
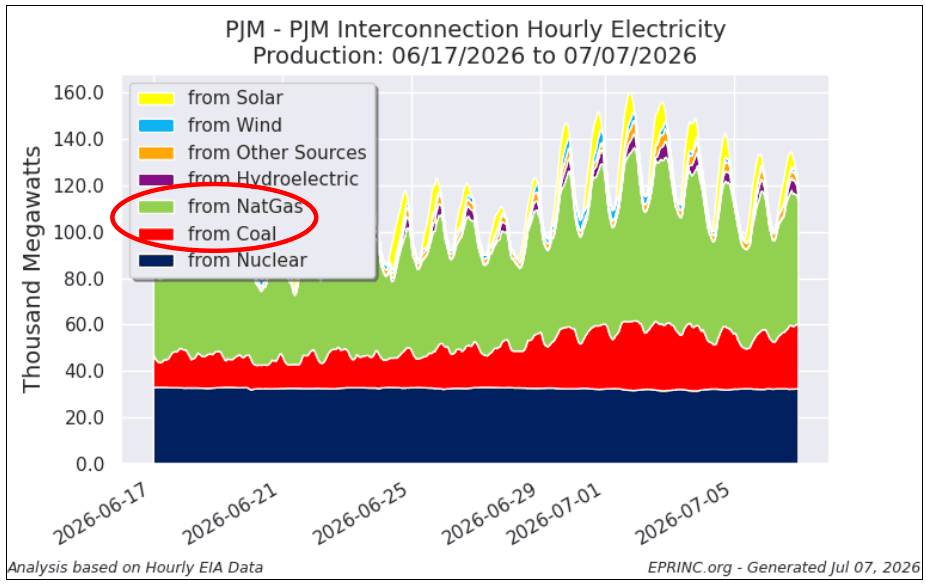
The first major U.S. heat wave of summer 2026 pushed a heat dome across the Central and Eastern U.S. in the days around July 4th, with temperatures regularly above 100°F. Hourly midday load on PJM, the nation’s largest grid operator, peaked near 160 GW, approaching the all-time record of 165,563 MW set in 2006.
The incremental supply came almost entirely from dispatchable generation. Nuclear, coal, and natural gas delivered 88% of the total, and the ramp concentrated in the two fuels that can be called on demand: coal rose from 14.3 to 24.2 GW (up roughly 69%) week-over-week, and gas from 43.6 to 55.0 GW (up 26%). Solar and wind held flat at 7.5 GW. The load event also triggered DOE’s third Section 202(c) emergency order of 2026, waiving plant emissions limits as wholesale prices topped $2,000/MWh.
U.S. Crude Oil Imports from Venezuela under shifting sanctions regimes
Mideast Military Aggression, Hormuz Strait Tanker Traffic, and Crude Oil Prices
Shale Production Has Revived Argentina’s Oil and Natural Gas Output
The Renewable Fuel Standard (RFS) and Transportation Fuel Prices – Revisited
Dallas Fed Survey: U.S. Crude Oil Production Costs Are Rising – Revisited
History of Oil Production Forecasts Shows Consistent Underestimate
Measuring Productivity Improvements in U.S. Shale Oil and Gas Production
Crude Oil and Product Movements: The North American Production Platform
U.S. Gasoline Sales, Vehicle Miles Traveled, And Motor Vehicle Fuel Efficiency Revisited
Impacts of the U.S. 2024 Presidential Election on Petroleum and Natural Gas Equities
European Natural Gas Constraints During the Winter Of 2024-2025
Regulatory Credit Contribution to Tesla’s Automotive Gross Profits
Virginia Electricity Demand Growth:
The Case of Data Centers
Alternative Economic Indicators: U.S. Diesel Prices and Shifts in Truck-Hauled Freight
Contention for U.S. Natural Gas Resources in Three New England States
U.S. Upward Reassessment of Electricity Demand in South Atlantic States
The Mid-2024 View: EU and Ukrainian Natural Gas Storage – A Contrasting Tale
Russian Pipelined Natural Gas to Europe: Is Ukraine’s Invasion a Threat?
Emissions Of Current Popular Vehicles and Required 2032 Compliance Levels
Revisited: Progress in U.S. Motor Vehicle Pollution Reduction Since 1970
EPA’s Power Plant Rule, Declining U.S. Electricity Generating Capacity, and Growing Power Demand
U.S. Crude Oil & Product Imports from Russia and Venezuela Under Shifting Sanctions Regimes
U.S. Insular Territories and The Energy Transition: A Summary View
Ukrainian Strikes on Russian Refineries and Global and U.S. Product Markets
ESG Assets Under Management (AUM): Global and U.S. Perspectives
Russian Pipeline Crude Oil Exports to Central Europe: Who is Complying with the Sanctions?
EPA’s Proposed Grid Performance Standards and Their Impact on MISO’s Electricity Grid
Potential Unintended Consequences of U.S. Natural Gas Production Curtailments
Number of U.S. Housing Units by Heating Fuel – 1940 to 2022: California, Texas, New York State
Revisiting European Pre-Winter Natural Gas Storage Builds: 2022 vs 2023
Exxon Mobil / Pioneer and Chevron / Hess Mergers in the Context of Global Liquid Fuels Production
Global Net Coal Power Plant Capacity Since the Paris Agreement
European Natural Gas Imports and Storage Ahead Of Winter 2023-2024
European Receipts of U.S. LNG Exports By Destination – Revisited
The Italian Duck Curve: Evolution of Italy’s August Electricity
U.S. Crude Oil Import Dependence
and Potential Vulnerability
Running on Empty Revisited: U.S. Strategic Petroleum Reserve Continues to Decline to Historic Lows
The Spanish Duck Curve: Evolution of Spain’s August Electricity Generation Resource Mix — 2019-2023
Impact from Canadian Wildfire Smoke On Solar Generation in the Northeastern U.S.
Russian Seaborne Crude Oil Exports and the Price Cap Mechanism
The RFS: Do D6 RIN Prices Impact Corn Prices? A Simple Regression Analysis
Liquefied Natural Gas (LNG) Demand Shift and Diversions from China to Europe
Running on Empty: U.S. Strategic Petroleum ReserveNow at Historic Lows
Calculating Foregone Tax Revenues per MMBTU of U.S. Primary Energy Production
GHG Impact of Inflation Reduction Act & Bipartisan Infrastructure Law
California Summer Hydroelectric Power Shortfall is Projected
Near- and Short-Term Financial Returns of Green and Legacy Energy Investments vs Key S&P Benchmarks
The North American Hydrocarbon Production Platform: Fueling the Americas, Generating Trade
Snapshot of Canadian Crude Oil, Petroleum Products, and Natural Gas Supply/Demand Balances
Seeking Gasoline Price Relief Through Strategic Petroleum Reserve (SPR) Sales
Federal Onshore Leases – Exploration & Potential Production Timeline
Are GazProm’s Natural Gas Volumes Increasing Through Ukraine and Slovakia as Some Claim?
U.S. Consumer Energy Expenditures as a Percentage of Disposable Income
Winter of 2021-2022: Natural Gas Inventories in the Northern Latitudes – Mid-Season Update
Onshore vs Offshore U.S. Royalties from Oil & Natural Gas Production
Foregone Tax Revenues from U.S. Plug-in Electric Vehicle Tax Credits
Foregone Tax Revenues from U.S. Federal Renewable Electricity Investment Credits
Foregone Tax Revenues from U.S. Federal Renewable Electricity Production Credits
Seeking Gasoline Price Relief Through Strategic Petroleum Reserve (SPR) Sales
Natural Gas Inventories Ahead of Winter in the Northern Latitudes 2021-2022
Fast Charging Electric Vehicle (EV) Stations: Some Considerations
High-Level Analysis of the Contribution of US Shale Gas to European Gas Prices and Savings
Incremental Growth in Global Natural Gas Production Since 2010
With High LNG Benchmark Prices, Some Asian Electricity Producers Are Considering Alternative Fuels
Natural Gas Prices are Signaling Tight Energy Markets Ahead of Winter
Can California Meet Its Aggressive Fossil Fuel GHG Reduction Targets?
Mexico’s and PEMEX’s Estimated Revenue from the Talos-Led Development of Zama: Proceeds Through 2040
Gasoline Demand Forecasting: The Challenges of Getting It Right
The Arctic National Wildlife Refuge Crude Oil Potential: An NPV Assessment
Can the California Electricity Grid Immediately Switch to an All EV Fleet?
U.S. Atlantic Coast is Dependent on Gulf Coast and MidContinent Petroleum Product Supplies
Can the U.S. Electricity Grid Immediately Switch to an All-EV Fleet?
Competition in U.S. Oil & Gas Upstream Development Yields Substantial Revenue to State Governments
Changes to Mexico’s Planned Electricity Capacity Additions pre/post AMLO
Dominick Blue
Distinguished Fellow
Dominick Blue is a Distinguished Fellow at the Energy Policy Research Foundation (EPRINC), where his research focuses on energy resilience, reliability, and the secure integration of emerging technologies into the power sector. His current work examines the intersection of advanced computing, infrastructure planning, and national energy security.Dominick’s research portfolio includes analysis of AI and data center electricity demand-forecasting regional load growth, reliability implications, siting dynamics, and market coordination. He also leads studies on grid modernization and energy security, assessing resilience investments, interconnection constraints, and federal–state coordination under higher load scenarios. His additional work explores the revival of the U.S. nuclear sector, financing and licensing pathways for advanced reactors, and rebuilding domestic manufacturing capacity to support the nuclear supply chain.Further research areas include gas-to-power infrastructure, pipeline and turbine capacity, and the role of gas in maintaining reliability within a diversified generation mix. Across these topics, Dominick focuses on translating complex technical findings into accessible policy insights for decision-makers at DOE, FERC, and state regulatory agencies.Before joining EPRINC, Dominick held senior leadership roles in infrastructure, technology, and risk management, including Managing Partner and Director of Client Innovation for private investment and global critical infrastructure firms, respectively. A former U.S. Marine Corps Chief Warrant Officer Two in CBRN Defense, he brings a mission-driven perspective to energy resilience and safety. He holds a Masters of Business from the University of Southern California and has completed graduate studies in Computer Science at Georgia Tech, with research interests in AI systems, resilient infrastructure, and energy transition security.