
Chart of the Week
A new chart every week.

Large Uncertainties Remain on Long-term Petroleum Demand
Long-term projections of global petroleum demand continue to diverge significantly across forecasts, reflecting substantial uncertainty about the future trajectory of…

U.S. LNG Exports by Destination Region Revisited
The destination mix for U.S. LNG exports shifted sharply after 2021, with Europe overtaking Asia as the leading buyer amid…

Mideast Military Aggression and OPEC+ Crude Production Management and Their Impact on Red Sea and Hormuz Straits Tanker Traffic and Crude Oil Prices
Over the past twelve months, crude oil prices have been pulled in opposing directions: escalating Middle East military conflict has…

Breakdown of California Gasoline Prices
California's retail gasoline price has consistently exceeded the U.S. national average, driven by a stack of state-specific fuel formulation rules,…

Alternative Economic Indicators: U.S. Diesel Prices and Shifts in Truck-Hauled Freight
Retail diesel prices and North American truck-hauled freight volumes move closely together, offering an alternative, high-frequency read on the strength…

Contention for U.S. Natural Gas Resources in Three New England States
In Massachusetts, Connecticut, and Rhode Island, natural gas heats 47% of the 4.7 million households while also supplying an average…

Hydrocarbon Share Of Global Electricity Generation
Hydrocarbons continue to account for a substantial share of global electricity generation, underscoring their persistent role in meeting worldwide power…

U.S. Upward Reassessment of Electricity Demand in South Atlantic States
A comparison of the EIA's December 2023 and July 2024 Short-Term Energy Outlooks shows that projected monthly electricity demand growth…

Comparing Residential Electricity Costs: Europe vs. U.S. States
This slide contains organizational copyright and contact information for the Energy Policy Research Foundation, Inc., along with photo attribution, and…

The Mid-2024 View: EU and Ukrainian Natural Gas Storage
In mid-2024, the EU was carrying natural gas inventories well above the trend of previous years, while Ukraine's inventories ran…

Russian Pipelined Natural Gas to Europe: Is Ukraine’s Invasion a Threat?
Ukraine's early-August 2024 incursion into Russia's Kursk Oblast, including the seizure of Gazprom's Sudzha compressor station, coincided with a measurable…
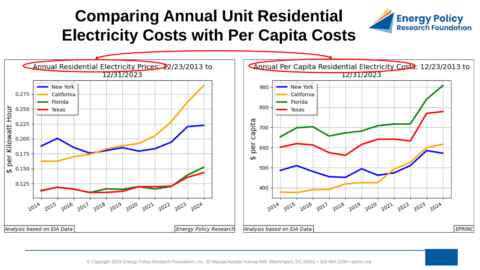
New York, California, Florida, Texas: Comparing Annual Unit Residential Electricity Costs with Per Capita Costs
Among the four most populous U.S. states, California has the highest residential electricity unit cost at 28.9 cents per kWh…
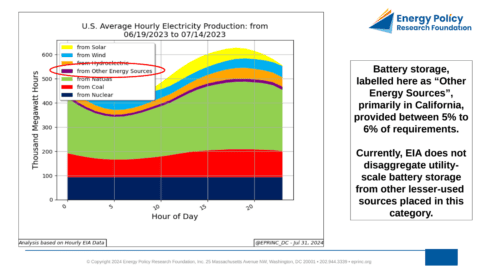
U.S. Mid-Summer Heat Wave Met by Record Natural Gas Power Generation
During the June 19–July 14, 2024 national heat wave, natural gas supplied between 38% and 52% of U.S. power requirements,…

Energy Policy Research Interactive Chart: IEA Critical Minerals Demand Growth
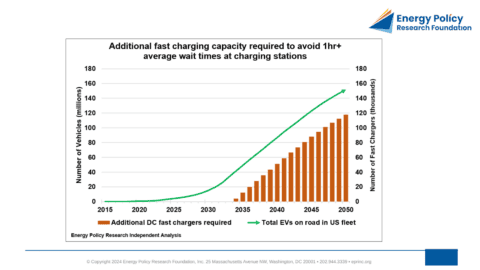
Errata: Additional DC Fast Charging Capacity Required Acceptability of EV Wait Times
An erratum revising two earlier charts finds that fewer DC fast chargers will be needed by 2050 than initially projected,…
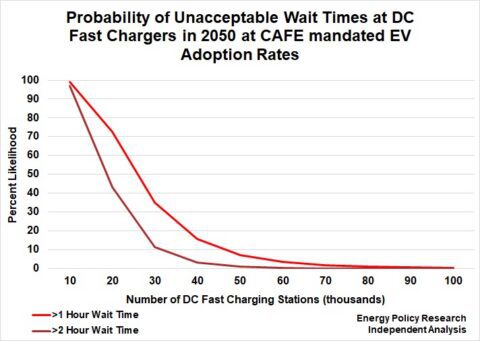
Acceptability of EV Wait Times at DC Fast Charging Locations
Even in scenarios where average EV wait times at DC fast charging stations are held under an hour, infrequent high-impact…
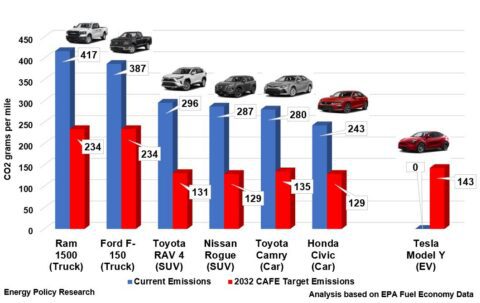
Emissions of Current Popular Vehicles and Required 2032 Compliance Levels
In March 2024, the EPA raised Corporate Average Fuel Economy (CAFE) standards to require light-duty vehicle emissions to fall to…
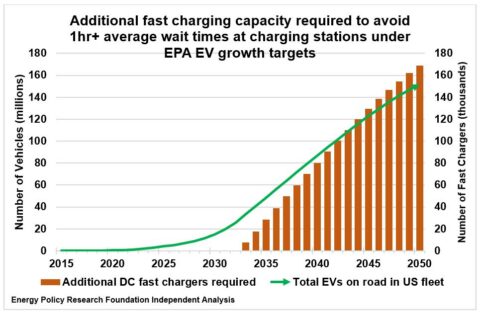
Potential for Charging Station Deficiency Under EPA’s Electric Vehicle (EV) Expansion Program
While the current U.S. network of fast charging stations is adequate for today's small EV fleet, EPRINC's analysis finds that…