
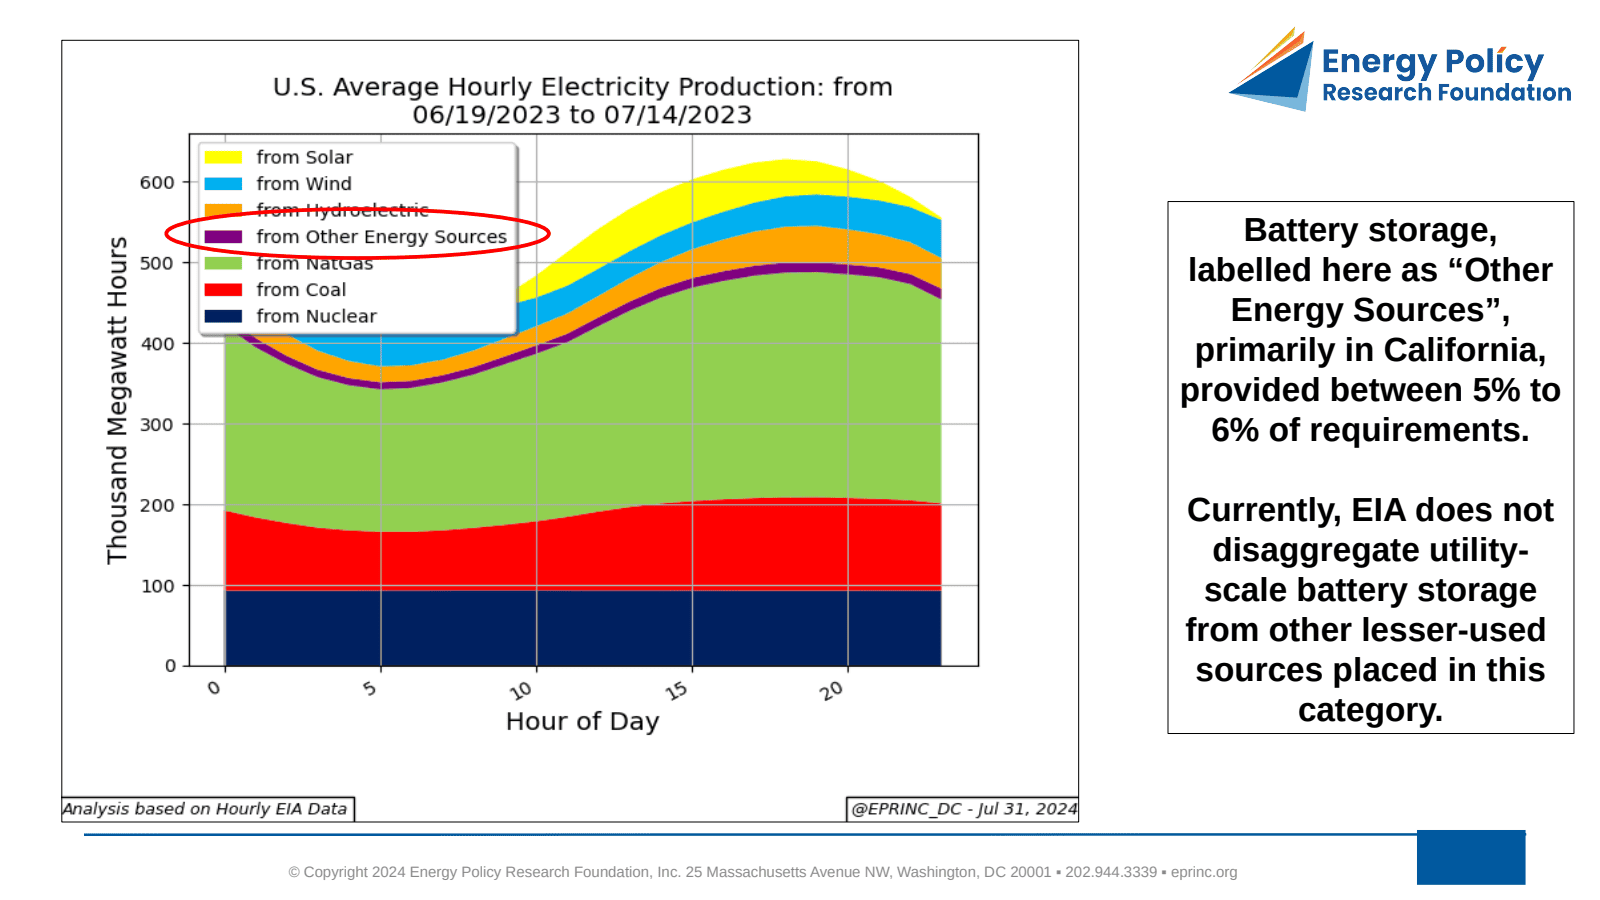
During the national heat wave that ran from June 19 to July 14, 2024, U.S. power demand rose sharply on air conditioning requirements. The chart tracks the share of generation supplied by each fuel source over the period, showing how the grid met peak summer load.
Natural gas produced between 38% and 52% of power requirements, the largest share throughout. It was followed by nuclear, which ranged between 15% and 21%, and coal, which held steady at 18% to 19%. Battery storage — labeled as “Other Energy Sources,” since the EIA does not currently disaggregate utility-scale batteries from other minor sources in this category — supplied between 5% and 6%, drawn primarily from California, and while still small, it is growing.
Wind ranged from 5% to 12% until it dropped off sharply on July 8, 2024. According to the U.S. Energy Information Administration, that wind fall-off led to the highest hourly natural gas generation ever recorded by the agency, as gas absorbed the shortfall to keep pace with demand.
From the EPRINC Chart of the Week archive.
Cite: EPRINC, “U.S. Mid-Summer Heat Wave Met by Record Natural Gas Power Generation,” Chart of the Week 2024-30, July 22, 2024.