
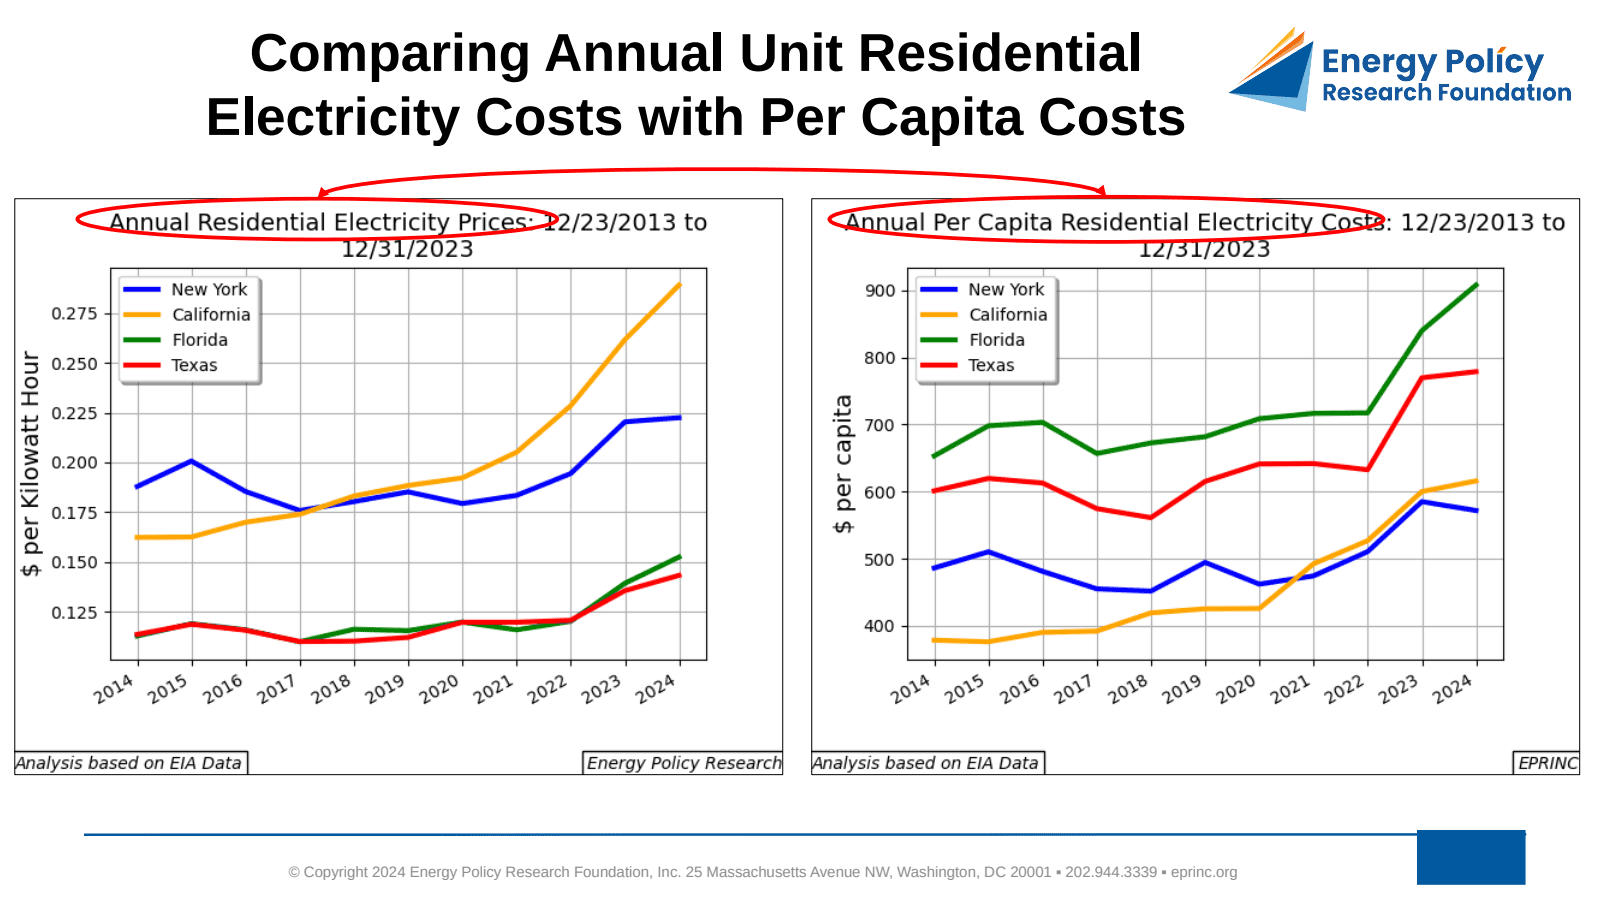
This Chart of the Week compares residential electricity profiles across the four largest U.S. states by population—California, Texas, Florida, and New York—using two distinct measures: annual unit cost (cents per kilowatt hour) and total annual per capita residential cost. Climate, population density, per capita residential space, and policy each play a material role in the differences.
On a unit-cost basis, California’s rate has risen the fastest over the last ten years, at an annual rate of almost 6%, reaching the highest absolute level at 28.9 cents per kWh in 2023. New York, Florida, and Texas stood at 22.3, 15.3, and 14.3 cents per kWh, with annual changes of 1.7%, 3%, and 2.35%, respectively. California’s renewable portfolio standard (RPS) policies, high fixed generation costs, and increased infrastructure spending—including vegetation management and burial of power lines—have strongly influenced its unit costs.
Total annual per capita residential cost tells a different story. Florida has carried the highest per capita cost of the four states, rising from $653 in 2013 to $908 in 2023, an annual rate of 3.4%. California’s mild coastal climate, where most of the state’s population resides, is an important factor holding down its per capita costs despite its high unit rate.
Per capita consumption in 2023 reinforces the pattern: Florida led at 16.3 kWh per day, followed by Texas at 14.9, New York at 7, and California at 5.9 kWh per day.
From the EPRINC Chart of the Week archive.
Cite: EPRINC, “New York, California, Florida, Texas: Comparing Annual Unit Residential Electricity Costs with Per Capita Costs,” Chart of the Week 2024-31, July 29, 2024.