
Chart of the Week
A new chart every week.
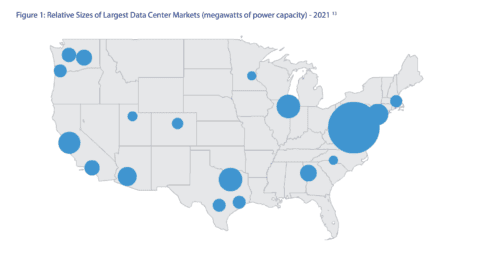
Figure 1. Relative Sizes of Largest Data Center Markets
Figure 1 compares the largest U.S. data center markets, showing that while California, Washington State, Texas, and Illinois host significant…
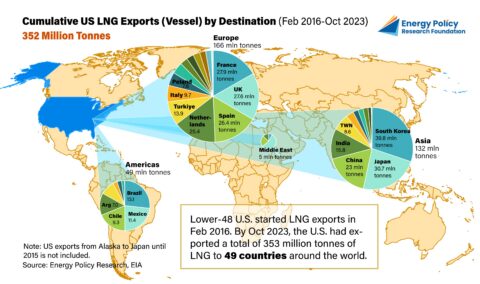
U.S. LNG Revisited
Reviewing 20 years of data, EPRINC finds the United States has exported 352 million metric tons of LNG to 49…
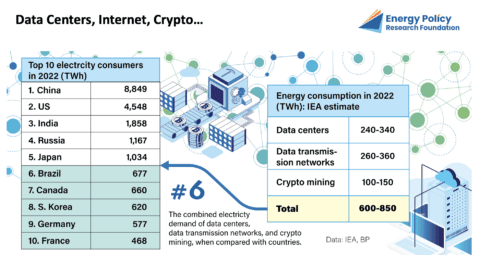
Figure 1. Energy Consumption of Data Centers, Data Transmission Networks, and Crypto Mining
The combined global electricity consumption of data centers, data transmission networks, and crypto mining has reached an estimated 600-850 TWh,…
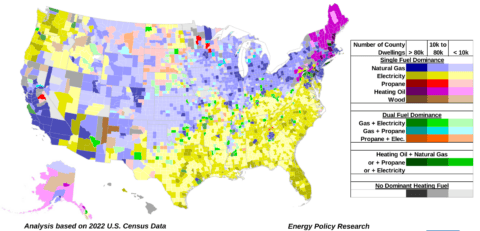
U.S. Residential Heating by County
Drawing on 2022 U.S. Census Bureau county-level data, EPRINC's map identifies the dominant residential heating fuel across more than 3,150…
Unintended Consequences Of Curtailments Of USNatural Gas Production
Because roughly 14% of U.S. natural gas is produced as associated gas alongside crude oil, curtailing gas output would ripple…
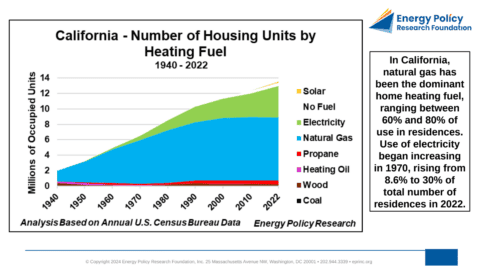
Number of Housing Units by Heating Fuel – 1940 to 2022: California, Texas, New York State
Census data on residential heating fuel from 1940 to 2022 reveal sharply different trajectories in three of the largest U.S.…
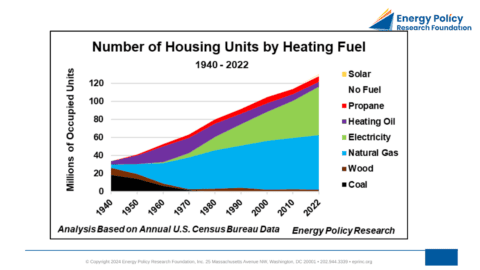
Number of U.S. Housing Units by Heating Fuel: 1940 to 2022
Since the 1970s, natural gas and electricity have displaced coal, wood, and heating oil to become the dominant fuels for…
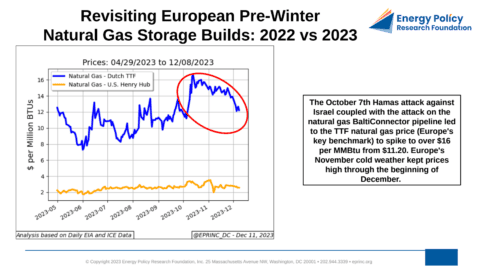
Revisiting European Pre-Winter Natural Gas Storage Builds: 2022 vs 2023
Entering the winter of 2023, EU natural gas storage stood at 3.785 trillion cubic feet — 224 billion cubic feet…

Exxon Mobil / Pioneer and Chevron / Hess Mergers in the Context of Global Liquid Fuels Production
The combined 2022 liquids output of Exxon Mobil, Pioneer, Chevron, and Hess totals 4.2 million barrels per day, or 4.2%…

U.S. CO2 Emissions from Hydrocarbon Fuel Consumption
U.S. CO2 emissions from hydrocarbon fuel consumption have fallen more than 20% from their mid-2000s peak, with EIA projecting 4.75…

Natural Gas Trade Lowers U.S. Trade Deficit – Revised
U.S. natural gas trade shifted from a deficit to a growing surplus over the past decade, with monthly net exports…

Net Additional Coal Generation Capacity Since the Paris Agreement
Since the 2015 Paris Agreement, coal-fired generation capacity has fallen by 164.4 GW in developed countries while rising by a…

European Natural Gas Imports and Storage Ahead of Winter 2023-2024
As of October 31, 2023, EU natural gas storage stood near 4 trillion cubic feet, roughly 12% above the five-year…

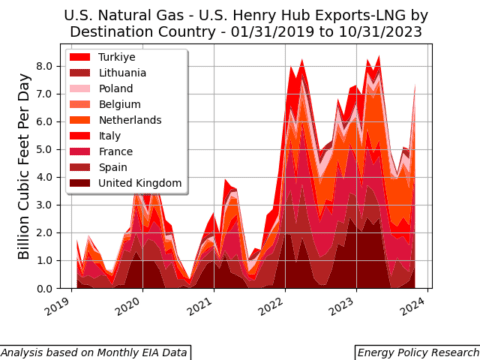
European Receipts of U.S. LNG Exports by Destination – Revisited
As Russia curtailed pipeline gas to Europe—cutting flows from a 2019 peak of 15 BCF/d to under 1 BCF/d by…

The Italian Duck Curve: Evolution of Italy’s August Electricity Generation Resource Mix — 2017-2023
As utility-scale solar has grown in Italy, its August electricity generation mix now displays the "Duck Curve" first observed in…

U.S. Crude Oil Import Dependence and Potential Vulnerability
U.S. crude oil imports have swung widely over seven decades, from near self-sufficiency in the late 1940s to a 2008…

Running on Empty Revisited: U.S. Strategic Petroleum Reserve Continues to Decline to Historic Lows
Following the Biden Administration's 220 million barrel drawdown—the largest in the reserve's history—the U.S. Strategic Petroleum Reserve has fallen to…

Seeking Price Relief Through SPR Sales – (Revisited 2)
Between November 2021 and March 2023, the Biden Administration released 220 million barrels from the Strategic Petroleum Reserve—the largest drawdown…