
Chart of the Week
A new chart every week.

LNG (Liquefied Natural Gas) Trade Lowers U.S. Trade Deficit
U.S. LNG exports, which began in 2016, have grown to become a measurable offset to the national trade deficit, with…

Rising U.S. Transportation Fuel Prices
After retreating from their twenty-year (non-inflation-adjusted) peaks in late summer 2022, U.S. transportation fuel prices are rising aggressively again, emerging…

The Spanish Duck Curve: Evolution of Spain’s August Electricity Generation Resource Mix — 2019-2023
As utility-scale solar has expanded in Spain, midday solar output increasingly displaces other generation, producing a "Duck Curve" that requires…

European Industrial Electricity Prices as a Measure of Energy Affordability
European industrial electricity prices held stable from 2007 through 2021 before spiking sharply in 2022 amid Russia's escalation of its…

Americas Net Oil Imports
Fig. 2 of 2 · Chart 2023-33 · Source: EPRINC From the EPRINC Chart of the Week archive.

U.S. Energy Security As Measured by Affordability
Consumer spending on motor vehicle fuel and other energy goods has fallen as a share of total disposable personal expenditures…

U.S. Energy Security As Measured by Import Dependency/Vulnerability
U.S. energy security, measured by petroleum import dependency, has improved substantially since imports peaked at 12 MB/d in 2006, with…
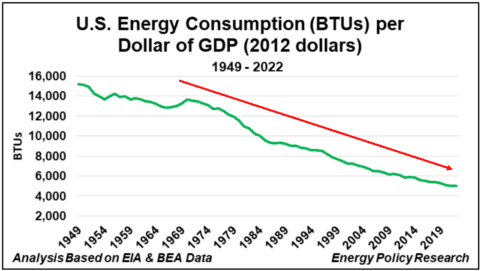
U.S. Energy Security As Measured by Efficiency
Measured as primary energy consumption per inflation-adjusted dollar of GDP, U.S. energy efficiency improved at an annualized rate of 1.5%…
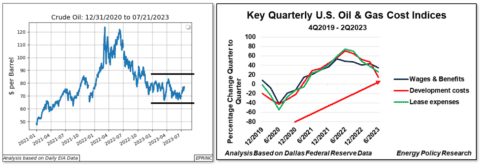
U.S. Crude Oil Production – Potential Headwinds
U.S. crude oil markets face flattening, range-bound prices and rising costs, conditions that are pulling down rig counts and slowing…
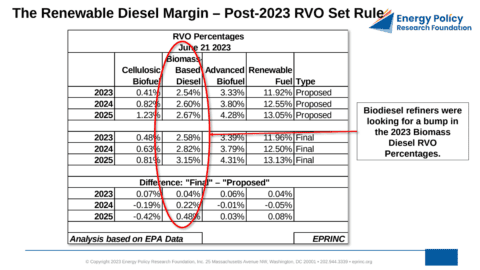
The Renewable Diesel Margin – Post-2023 RFS RVO Set Rule
Following EPA's June 21, 2023 final Renewable Fuel Standard "set" rule, which held the 2023 biomass diesel volume obligations flat…
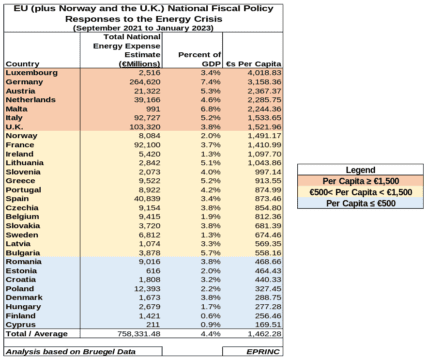
EU (plus Norway and the U.K.) National Fiscal Policy Responses to the Energy Crisis: September 2021 to January 2023
European governments committed an estimated €758 billion ($833 billion) between September 2021 and January 2023 to shield consumers from surging…
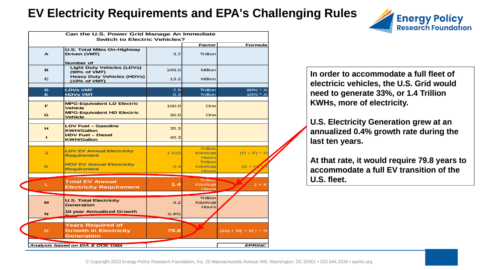
EV Electricity Requirements and EPA’s Challenging Rules
Two EPA rules proposed in 2023 work at cross-purposes: one would sharply raise electric vehicle production while the other would…
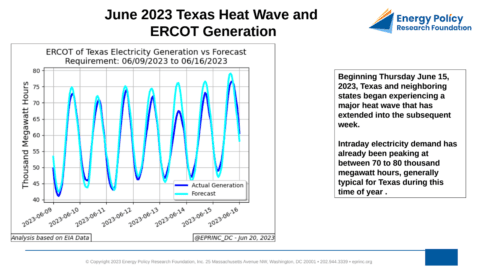
June 2023 Texas Heat Wave and ERCOT Generation
During the major heat wave that began June 15, 2023, ERCOT intraday electricity demand peaked at roughly 70,000 to 80,000…
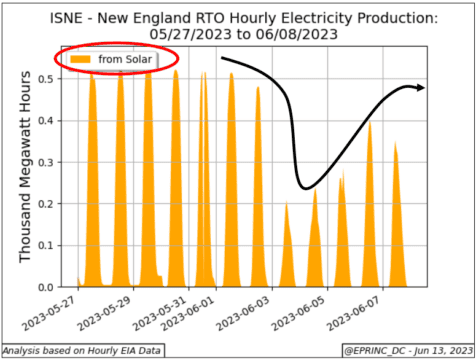
Impact from Canadian Wildfire Smoke On Solar Generation in the Northeastern U.S.
During the Canadian wildfire smoke event of June 5–8, 2023, solar generation in ISO New England fell to between 40%…
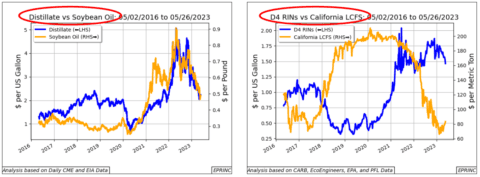
Calculating The Renewable Diesel Margin
The renewable diesel margin, a spread that gauges the implied returns of renewable diesel production, showed little volatility from 2016…
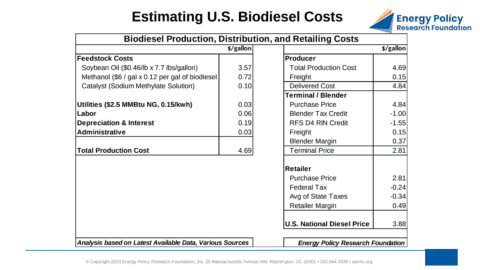
Estimating U.S. Biodiesel Costs
A typical gallon of commercially produced biodiesel costs nearly $4.70, well above the current national average retail diesel pump price…
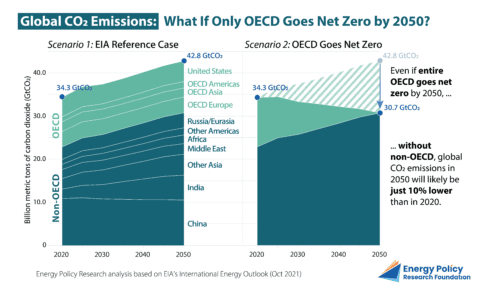
Global CO₂ Emissions: What If Only OECD Goes Net Zero by 2050? Batt Odgerel May 24, 2023 Washington, DC
Even if all OECD countries were to achieve net zero CO₂ emissions by 2050, global emissions would continue to be…
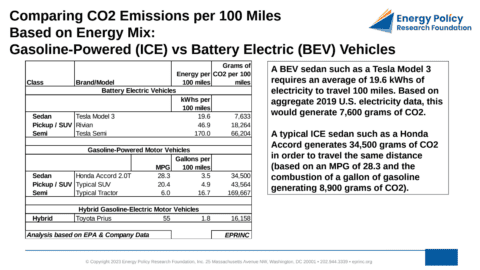
Comparing CO2 Emissions per 100 Miles Based on Energy Mix: Gasoline-Powered vs Battery Electric Vehicles
Based on the 2019 U.S. electricity mix, a battery-electric sedan generates roughly 7,600 grams of CO2 to travel 100 miles,…