
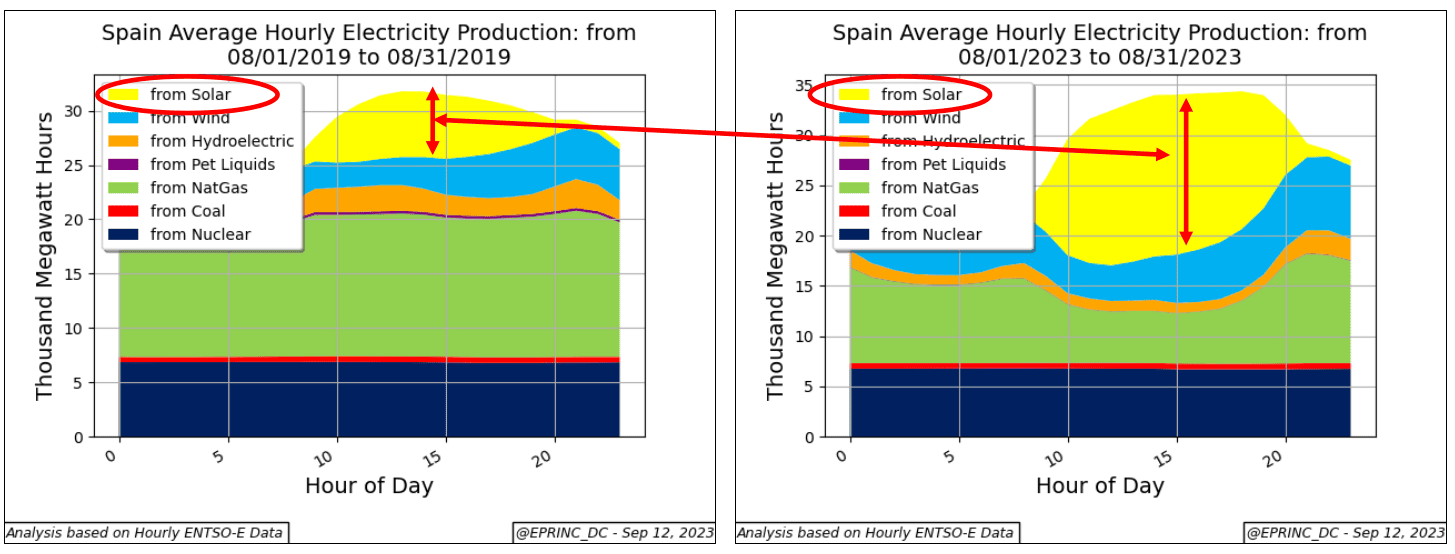
The chart tracks the composition of Spain’s electricity generation resource mix during the month of August across five years, from 2019 through 2023. It illustrates how the growth of utility-scale solar photovoltaic generation has reshaped the daily generation profile.
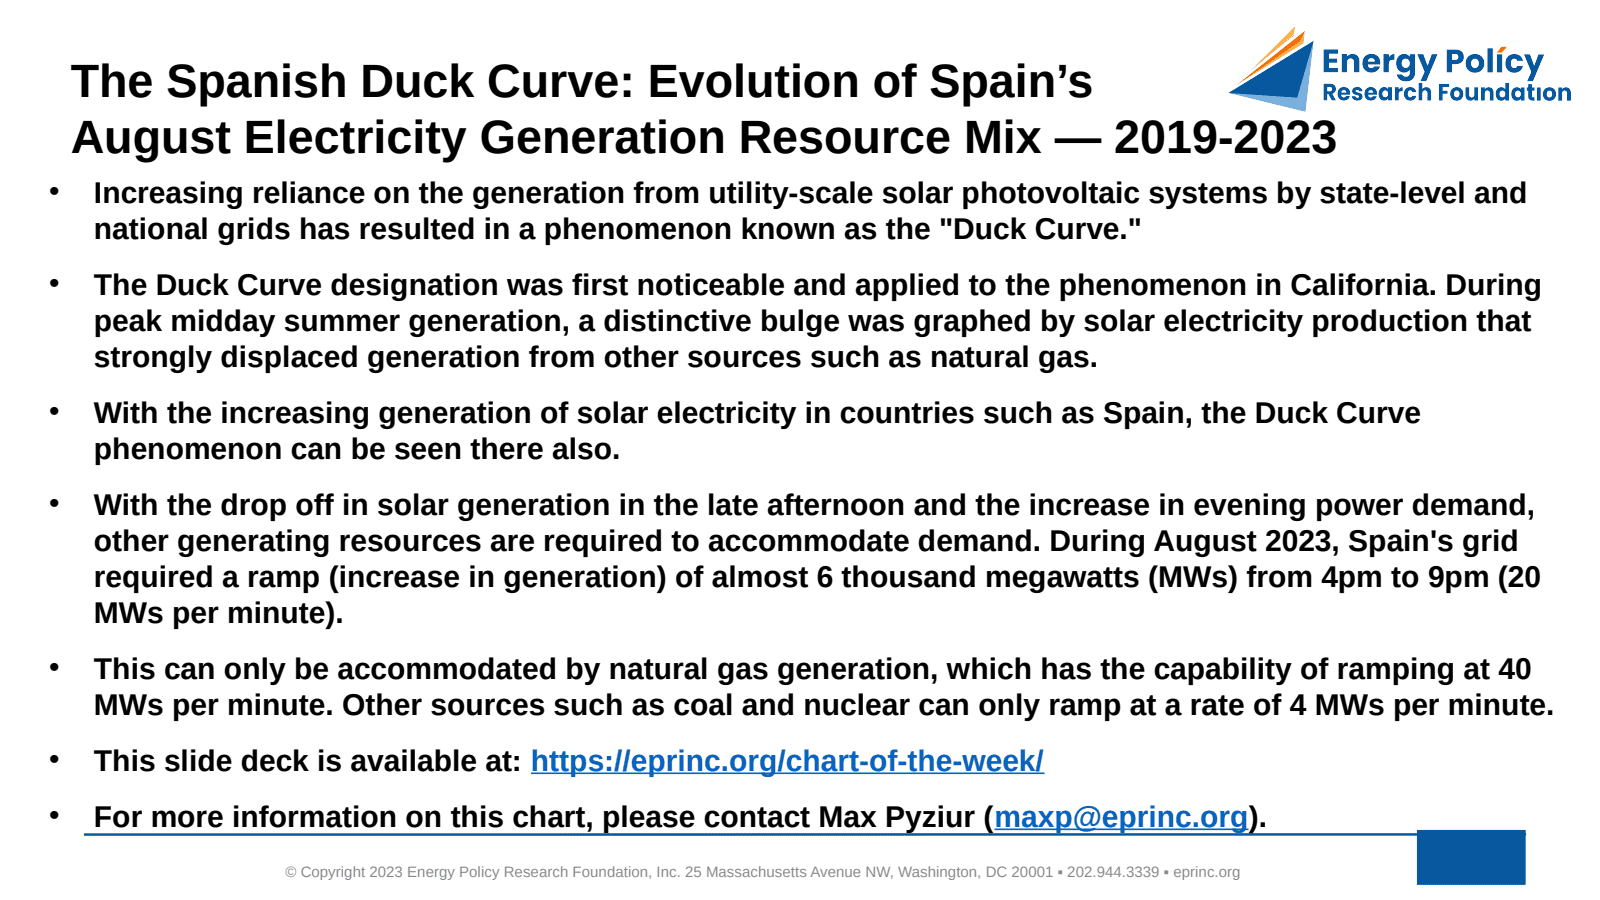
The “Duck Curve” describes the distinctive pattern that emerges as solar generation expands: a pronounced midday bulge of solar output that strongly displaces generation from other sources. The phenomenon was first identified and named in California, and with rising solar generation it is now visible in Spain as well.
The operational challenge arises in the late afternoon and evening, when solar output falls off just as power demand rises. During August 2023, Spain’s grid required a ramp of nearly 6,000 megawatts between 4pm and 9pm — roughly 20 megawatts per minute — to meet demand as solar generation declined.
Meeting a ramp of this magnitude depends on generation resources capable of increasing output quickly. Natural gas generation can ramp at approximately 40 megawatts per minute, making it well suited to the task. By contrast, coal and nuclear generation can ramp at only about 4 megawatts per minute, leaving natural gas as the primary resource able to accommodate the evening demand increase.
From the EPRINC Chart of the Week archive.
Cite: EPRINC, “The Spanish Duck Curve: Evolution of Spain’s August Electricity Generation Resource Mix — 2019-2023,” Chart of the Week 2023-35, August 28, 2023.