
Chart of the Week
A new chart every week.
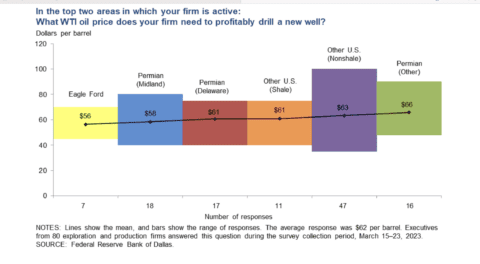
Dallas Fed Survey: U.S. Crude Oil Production Costs Are Rising
The Dallas Federal Reserve's first quarter 2023 survey shows U.S. crude oil producers' costs have risen since 2020, with the…
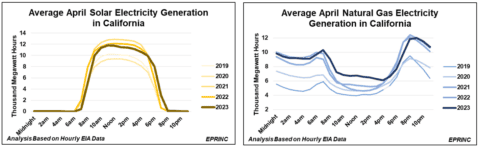
April in Sacramento: More Solar Generation in California Requires More Natural Gas Generation
As California's solar output grows, the state must call on natural gas generation to ramp up rapidly each afternoon as…
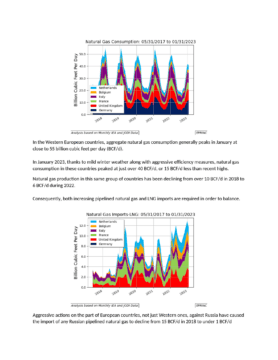
Western European Near-Term Natural Gas Requirements
Western European natural gas consumption typically peaks near 55 BCF/d in January, but mild winter weather and efficiency measures held…
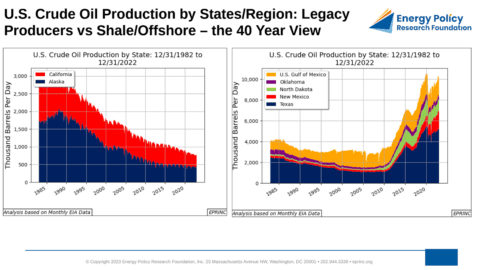
U.S. Crude Oil Production by States/Region: Legacy Producers vs Shale/Offshore – the 40 Year View
U.S. crude oil production over the past forty years has shifted markedly in both scale and geography, as legacy output…
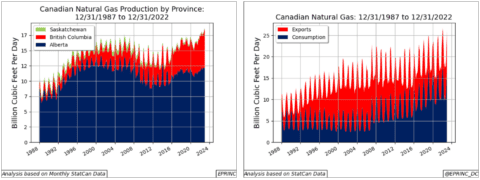
Canadian Provincial Oil & Natural Gas Production, Related Consumption and Exports
Canada is the world's fourth-largest crude oil producer and sixth-largest natural gas producer, with production concentrated in a few western…
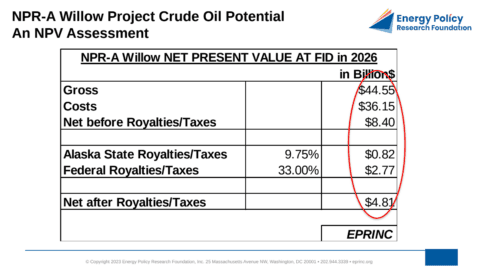
After Extensive Deliberation The National Petroleum Reserve-Alaska (NPR-A) Willow Project Is Set To Yield Revenue For Both The State And The Federal…
ConocoPhillips's Willow Project in the National Petroleum Reserve-Alaska carries an estimated net present value of $44.6 billion, with $2.8 billion…
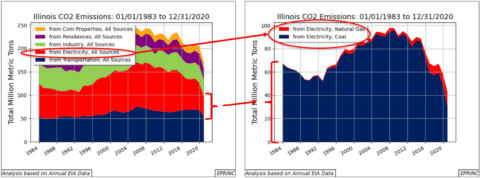
Illinois CO2 Emissions From Electricity Production
In 2019, Illinois' electricity generation emitted 58.2 million metric tons of CO2, equal to 1.1% of the U.S. total and…
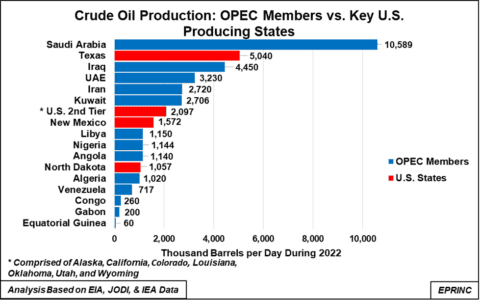
Crude Oil Production: OPEC Members vs. Key U.S. Producing States
U.S. crude oil production has surged to 11.9 million barrels per day in 2022 from 5 million in 2008, and…
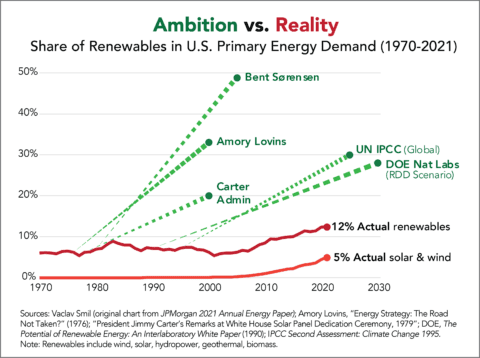
Renewable Share In USPrimary Energy Demand
Despite decades of ambitious scenarios and government targets for renewable energy in the United States, renewables continue to account for…
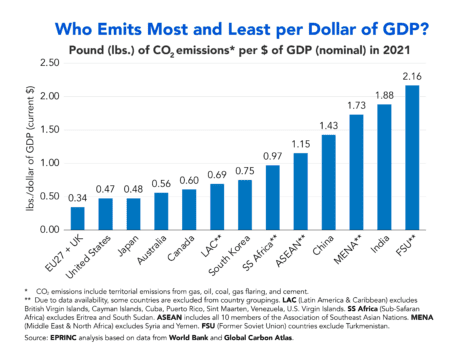
CO2 Per Dollar Of GDP
Despite mounting pressure to cut emissions quickly, the United States and its OECD peers remain among the least emission-intensive economies…
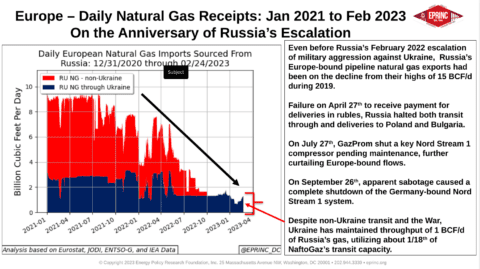
On the Anniversary of Russia’s Escalation
One year after Russia's escalation of its war against Ukraine, LNG became Europe's primary source of natural gas over the…
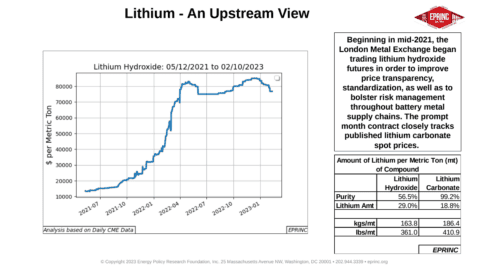
Lithium – An Upstream View
Lithium prices have risen sharply as demand for battery metals outpaces supply, tripling the lithium cost embedded in a single…
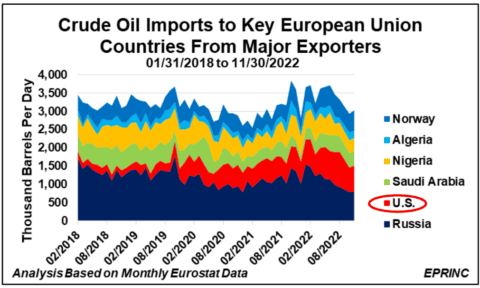
EU Crude Oil Trade: Shifts due to Russia’s War
EU crude oil imports have held relatively steady over the past five years, but Russia's war has reshaped their sources:…
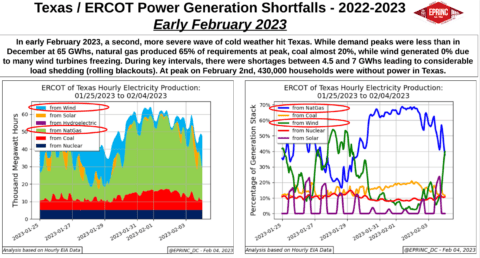
ERCOT: Freezin’ Down in Texas – Mid-Winter 2022-2023 Generation Mix, Shortfalls, and Refinery Utilization
During the winter of 2022-2023, two waves of extreme cold forced Texas' ERCOT grid into repeated generation shortfalls, with natural…
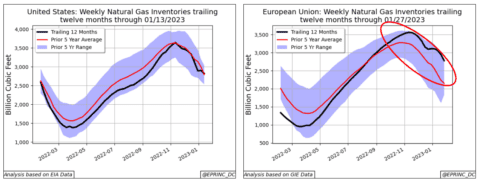
Natural Gas Storage Mid-Winter 2022-2023 in the Northern Latitudes
Coordinated emergency measures by European leaders, combined with mild winter weather, have muted natural gas demand and contributed to ample…
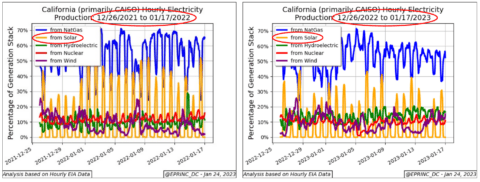
California Solar Generation During the 2022-2023 Pineapple Express
During the 2022-2023 "Pineapple Express," heavy rain and cloud cover cut California's midday solar output to an average of 6.9…
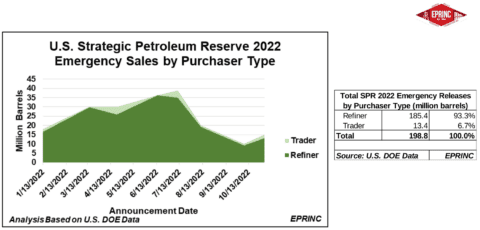
U.S. SPR 2022 Emergency Sales by Purchaser Type
Of the roughly 200 million barrels sold under the 2022 emergency SPR drawdown, refiners took 93.3% and trading organizations 6.7%;…
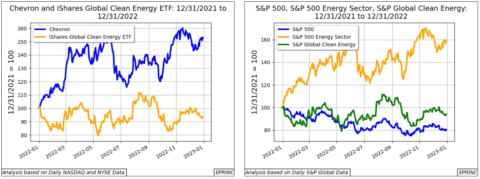
Revisited: Near- and Short-Term Financial Returns of Green and Legacy Energy Investments vs Key S&P Benchmarks
A comparison of near- and short-term financial returns finds that legacy energy investments, green energy investments, and key S&P benchmarks…