
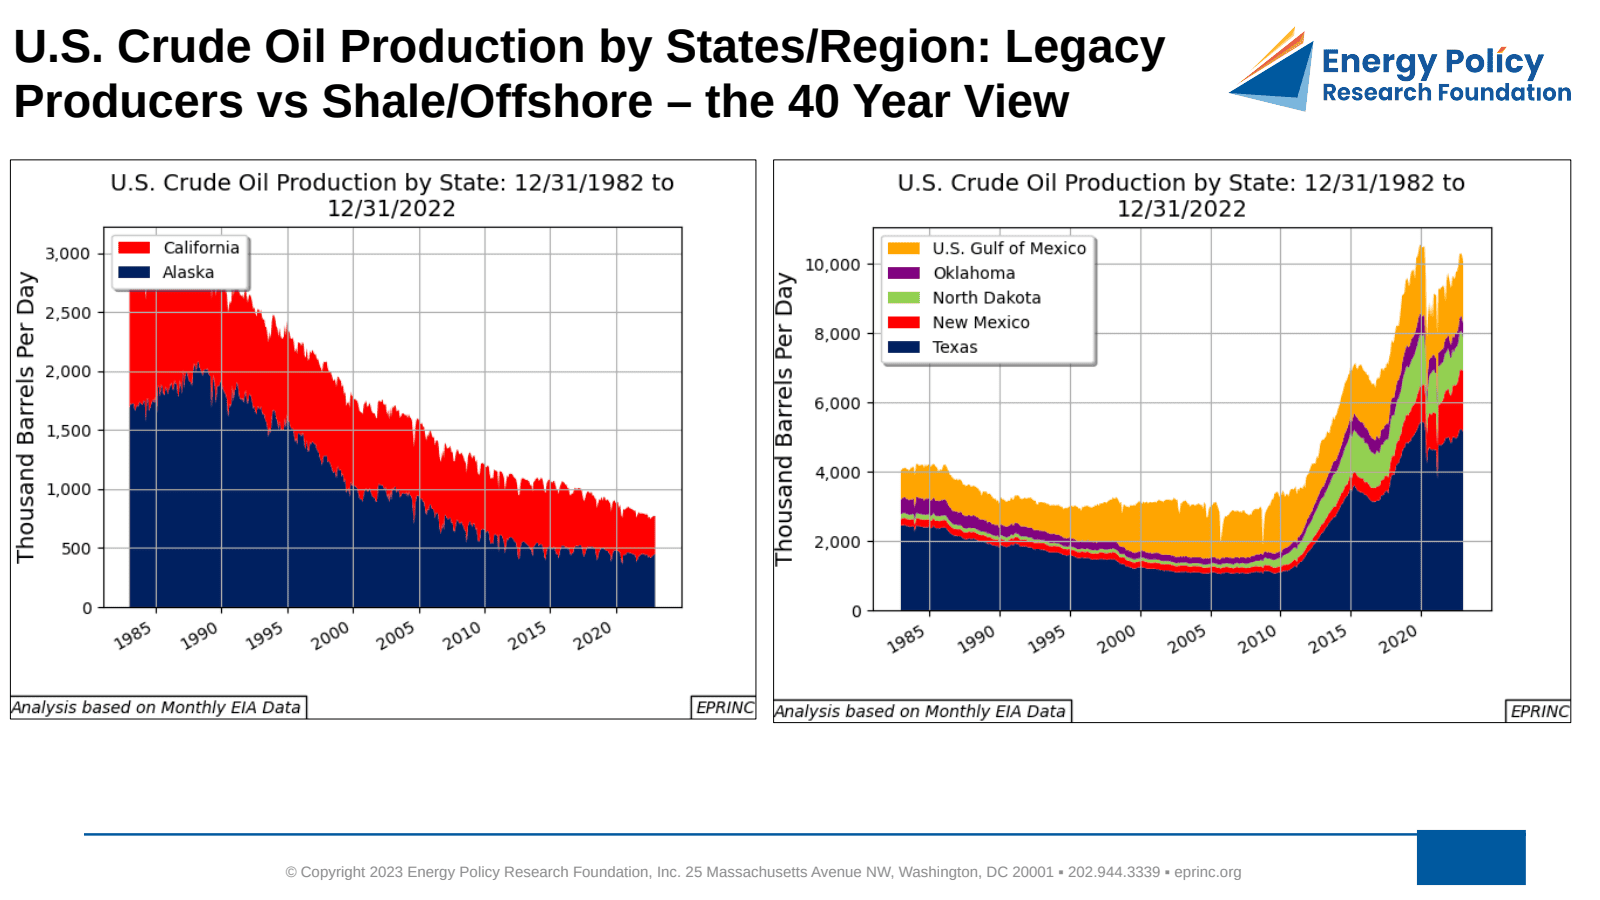
This week’s chart traces four decades of U.S. crude oil production, distinguishing legacy producing regions from the shale and offshore resources that now dominate national output. Over this period, both the magnitude and the geographic origin of U.S. production have changed substantially.
During the late 1980s, Alaska and California together averaged roughly 3 million barrels per day (MB/d), about 25% of total U.S. requirements at the time. Absent new discoveries or developments, their combined production has fallen to 750,000–800,000 barrels per day over the last decade.
The development of horizontal drilling and hydraulic fracturing during the 2000s made existing and new resources in Texas, New Mexico, North Dakota, and Oklahoma considerably more commercially viable. Combined production in these states peaked in the late 1980s at 3.2 MB/d, then declined to a low of about 1 MB/d in the mid-2000s. With the wider adoption of these technologies, current production from these states now exceeds 8 MB/d.
Federal Gulf of Mexico production has been substantial but episodically variable. It peaked at roughly 1 MB/d in the late 1980s, then again at 1.6 MB/d in mid-2002. In late 2019, Gulf of Mexico production reached an all-time high of 2.0 MB/d and has averaged 1.7 MB/d since.
From the EPRINC Chart of the Week archive.
Cite: EPRINC, “U.S. Crude Oil Production by States/Region: Legacy Producers vs Shale/Offshore – the 40 Year View,” Chart of the Week 2023-16, April 17, 2023.