
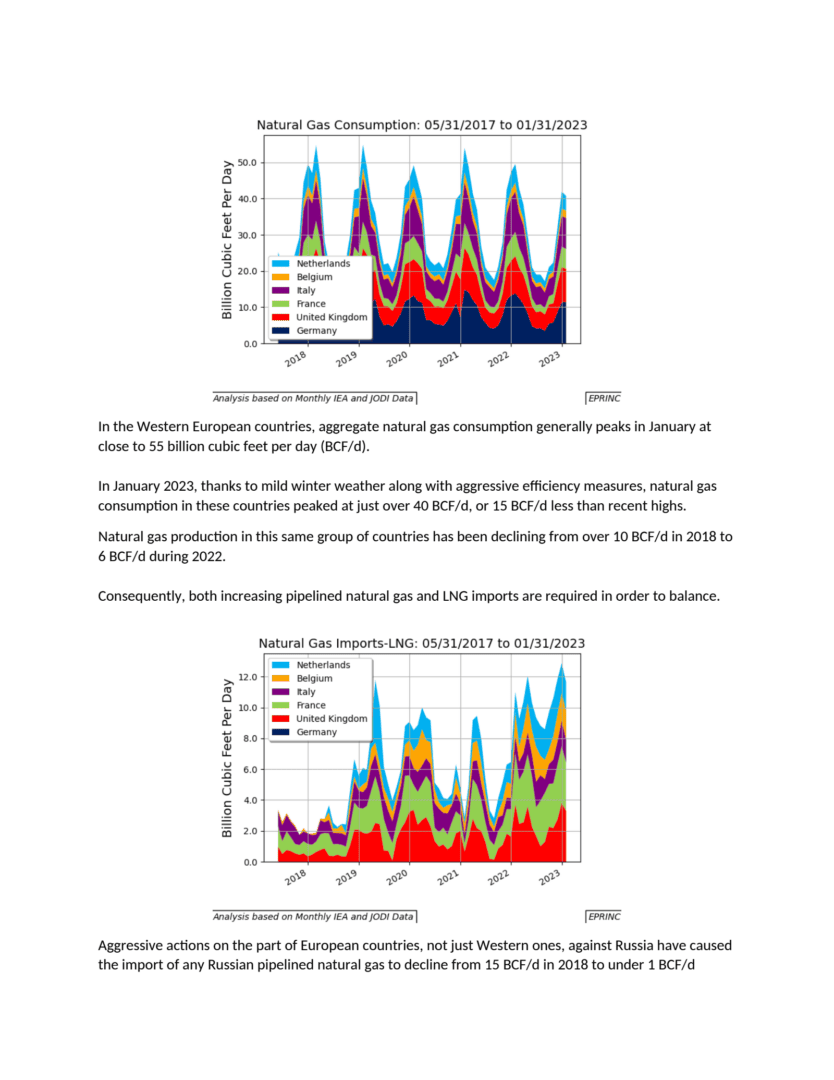
The chart tracks near-term natural gas requirements across Western European countries, comparing consumption, domestic production, pipeline imports, and LNG imports. Aggregate consumption in these countries generally peaks in January at close to 55 BCF/d. In January 2023, however, mild winter weather combined with aggressive efficiency measures held the peak to just over 40 BCF/d, roughly 15 BCF/d below recent highs.
On the supply side, domestic production has been declining, falling from over 10 BCF/d in 2018 to 6 BCF/d during 2022. At the same time, actions taken by European countries against Russia have reduced imports of Russian pipeline gas from 15 BCF/d in 2018 to under 1 BCF/d currently. Both trends have forced greater reliance on other sources to balance demand.
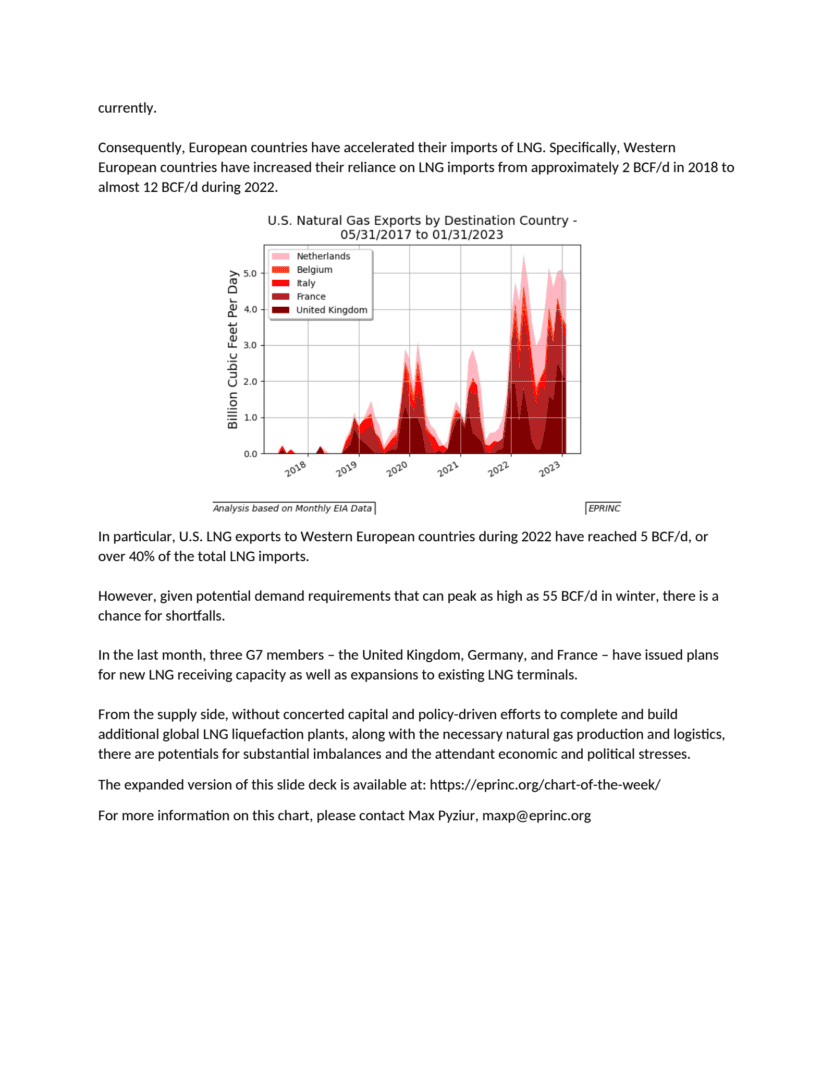
LNG has filled much of the gap. Western European LNG imports rose from approximately 2 BCF/d in 2018 to almost 12 BCF/d during 2022. U.S. LNG exports to these countries reached 5 BCF/d in 2022, accounting for over 40% of total LNG imports.
Given that winter demand can peak as high as 55 BCF/d, the potential for shortfalls remains. In the past month, three G7 members — the United Kingdom, Germany, and France — have issued plans for new LNG receiving capacity and expansions to existing terminals. On the supply side, without concerted capital and policy-driven efforts to build additional global liquefaction capacity alongside the necessary production and logistics, substantial imbalances and their attendant economic and political stresses remain possible.
The expanded version of this slide deck is available at EPRINC’s Chart of the Week.
From the EPRINC Chart of the Week archive.
Cite: EPRINC, “Western European Near-Term Natural Gas Requirements,” Chart of the Week 2023-17, April 24, 2023.