
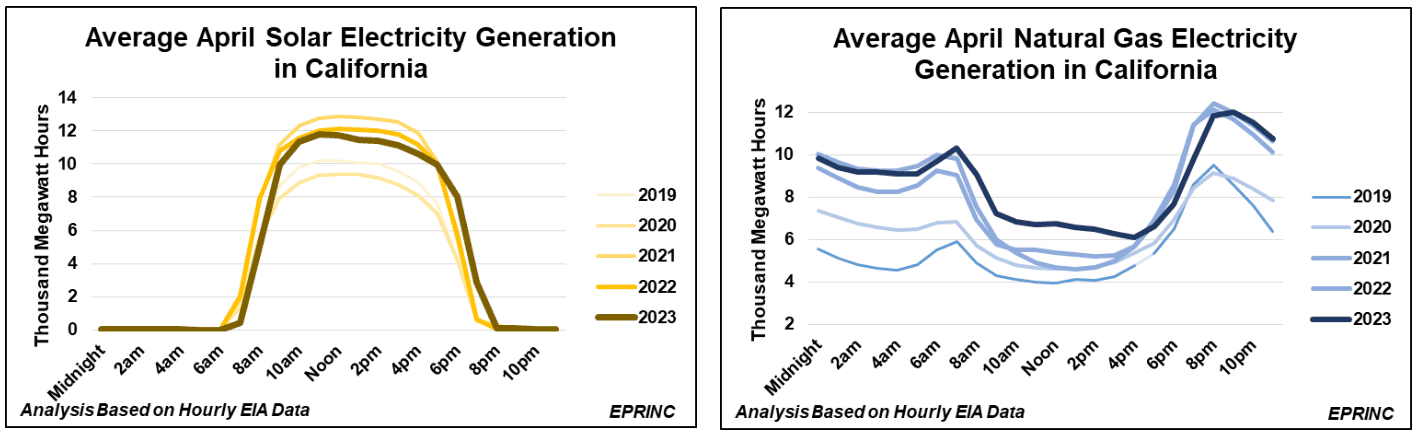
Investment tax credits (ITCs) and Renewable Portfolio Standards (RPS) mandates have driven the expansion of solar generation in California. Averaging across the month of April, noon-time solar generation peaked this year at almost 12 thousand megawatt hours (MWh), compared with 10 thousand MWh in 2019. The graphical representation of the non-solar generation that is displaced by this growing midday bulge of solar output has come to be known as the “duck curve.”
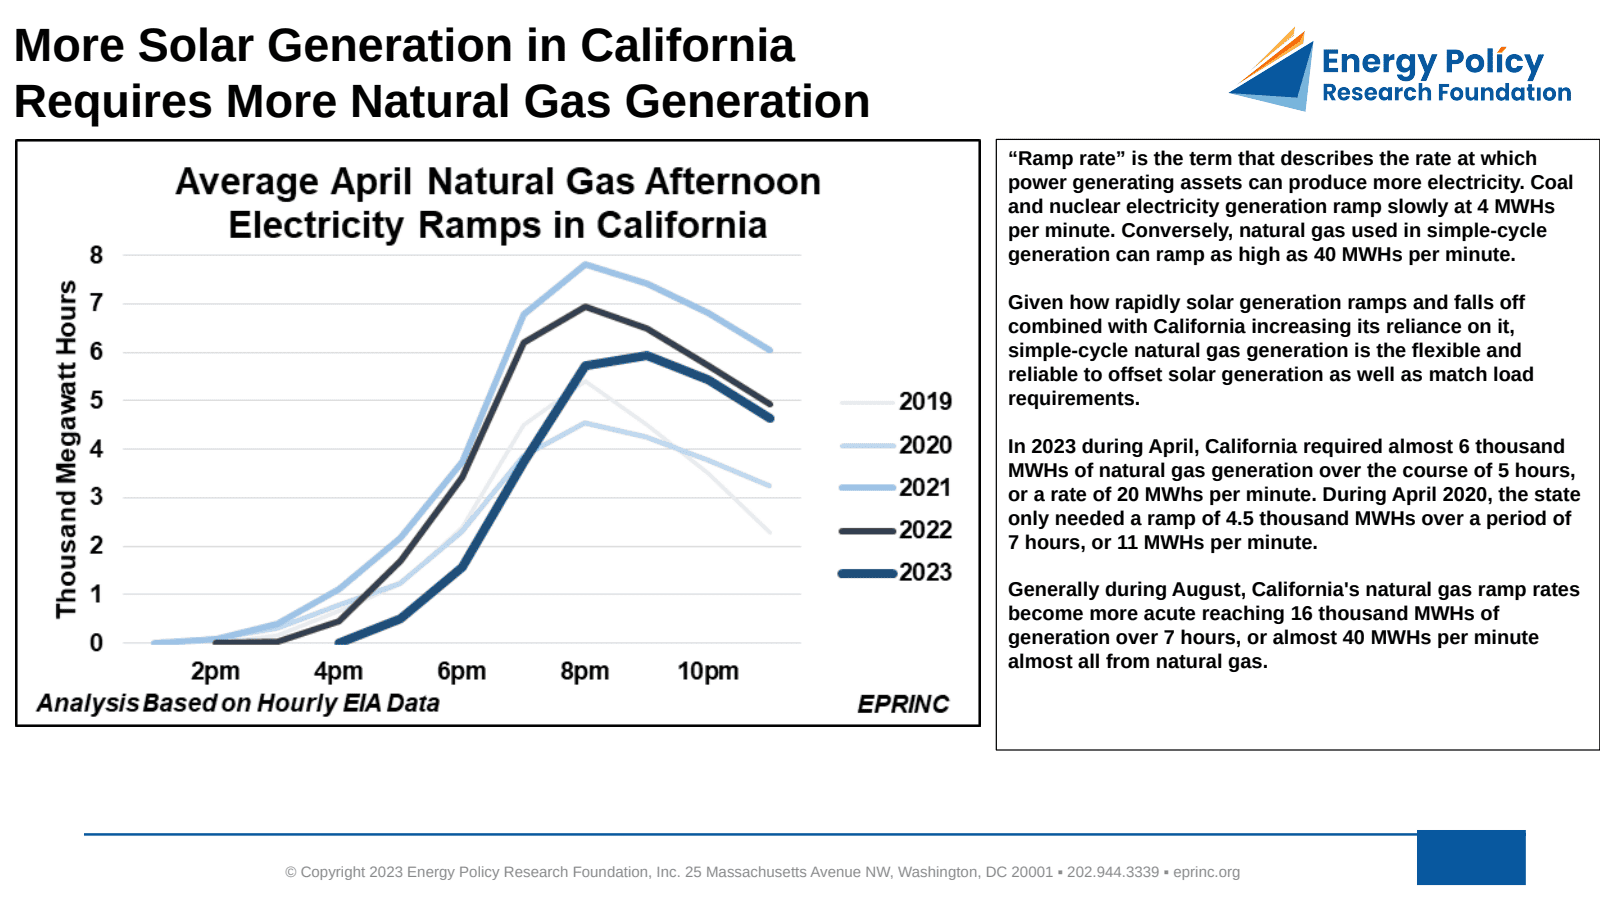
The chart tracks the “ramp rate”—the rate at which power generating assets can increase output—needed to offset solar as it falls off in the late afternoon. Coal and nuclear generation ramp slowly, at roughly 4 MWh per minute, while natural gas used in simple-cycle generation can ramp as high as 40 MWh per minute. Given how rapidly solar generation ramps up and falls off, and California’s increasing reliance on it, simple-cycle natural gas provides the flexible and reliable generation required to offset solar and match load.
The demand on natural gas has grown as solar penetration has increased. In April 2023, California required almost 6 thousand MWh of natural gas generation over the course of five hours—a rate of 20 MWh per minute. In April 2020, the state needed a ramp of only 4.5 thousand MWh over seven hours, or about 11 MWh per minute.
These ramp requirements become more acute in summer. During August, California’s natural gas ramp typically reaches 16 thousand MWh of generation over seven hours—almost 40 MWh per minute, nearly all of it from natural gas—underscoring that greater solar capacity is accompanied by a continued, and in some periods heightened, reliance on flexible natural gas generation.
From the EPRINC Chart of the Week archive.
Cite: EPRINC, “April in Sacramento: More Solar Generation in California Requires More Natural Gas Generation,” Chart of the Week 2023-18, May 1, 2023.