
Chart of the Week
A new chart every week.

U.S. Crude Oil Production New EIA Data Reveals Shortfalls
Since the COVID-related supply decline, U.S. crude oil production has recovered by 1.6 million barrels per day. However, despite significant…
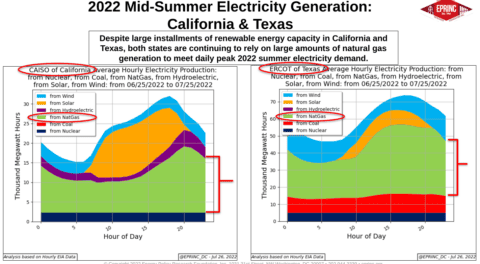
Mid-Summer Electricity Generation: California & Texas
Despite large installments of renewable energy capacity in California and Texas, both states continue to rely on substantial natural gas…
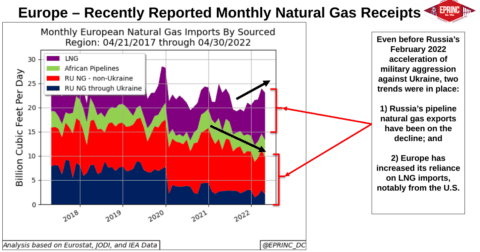
Europe – Recently Reported Monthly Natural Gas Receipts
European natural gas supply patterns reflect two trends that preceded Russia's February 2022 escalation of military aggression against Ukraine: a…
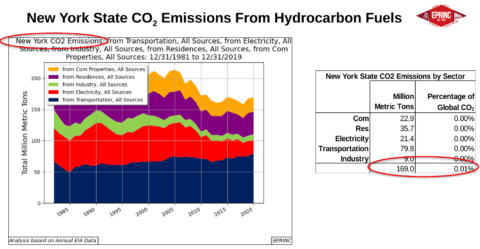
New York State CO2 Emissions From Hydrocarbon Fuels
New York State's CO2 emissions from hydrocarbon fuels are presented across fuel types, illustrating the state's emissions profile from petroleum,…
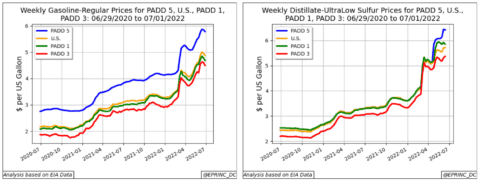
2022 Mid-Summer Retail Transportation Fuel Prices
This EPRINC Chart of the Week examines retail transportation fuel prices as of mid-summer 2022.
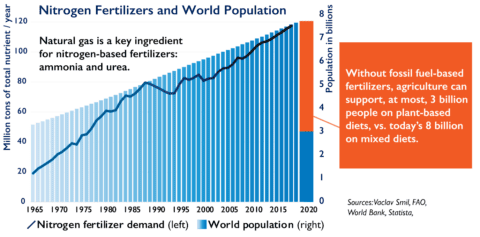
Revised: Natural Gas and Global Food Production
Natural gas serves as a critical input to global food production, underscoring the linkage between energy supply and agricultural output.
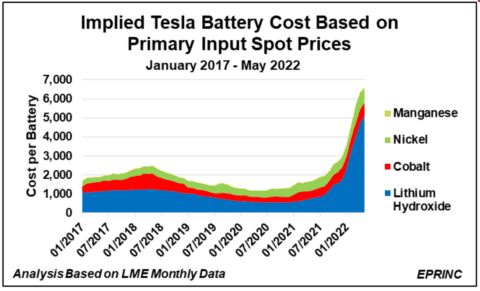
Implied Tesla Battery Production Costs
Estimates of Tesla's implied battery production costs indicate the cost trajectory associated with the company's electric vehicle manufacturing.
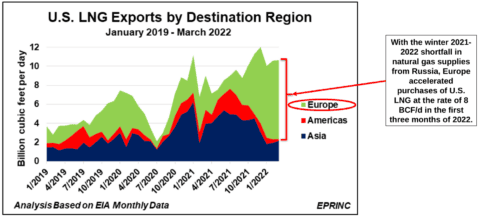
U.S. LNG Exports: Recent Trends
With the winter 2021–2022 shortfall in natural gas supplies from Russia, Europe accelerated purchases of U.S. LNG at a rate…
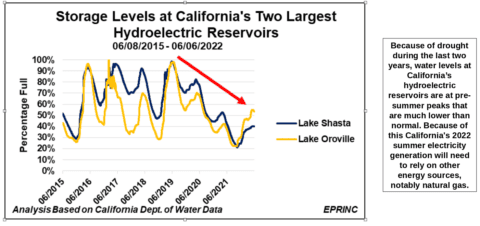
California Summer Hydroelectric Power Shortfall is Projected
Following two years of drought, water levels at California's principal hydroelectric reservoirs are entering the summer at pre-peak levels well…
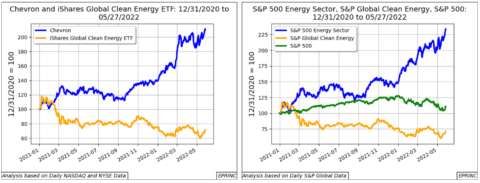
Near- and Short-Term Financial Returns of Green and Legacy Energy Investments vs Key S&P Benchmarks
Over the near- and short-term periods examined, legacy energy investments outperformed green energy investments when measured against key S&P benchmarks.
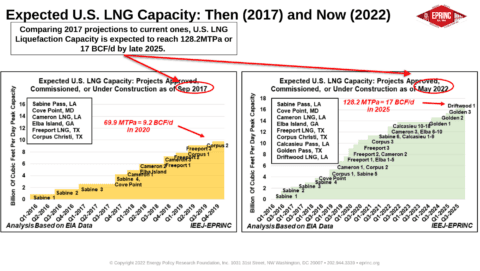
Comparing Freeport LNG Contribution Expected U.S. LNG Capacity: Then (2017) and Now (2022)
Comparing 2017 projections to current ones, U.S. LNG liquefaction capacity is expected to reach 128.2 MTPa, or 17 BCF/d, by…
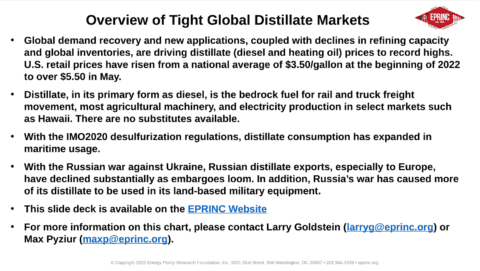
Overview of Tight Global Distillate Markets
Global demand recovery and new applications, combined with declines in refining capacity and inventories, are driving distillate (diesel and heating…
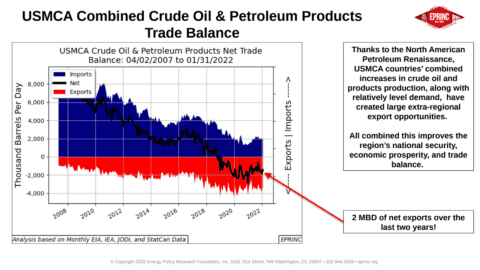
The North American Hydrocarbon Production Platform: Fueling the Americas Generating Trade
The North American Petroleum Renaissance, marked by combined USMCA increases in crude oil and petroleum products production alongside relatively level…
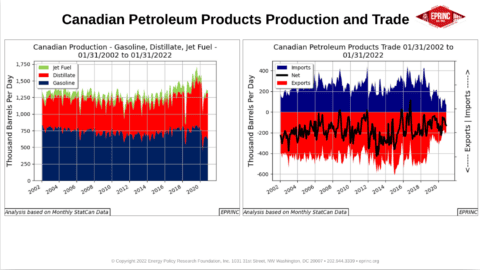
Snapshot of Canadian Crude Oil, Petroleum Products, and Natural Gas Supply/Demand Balances
Canadian crude oil production has doubled over the past 20 years to more than 4 million barrels per day, led…
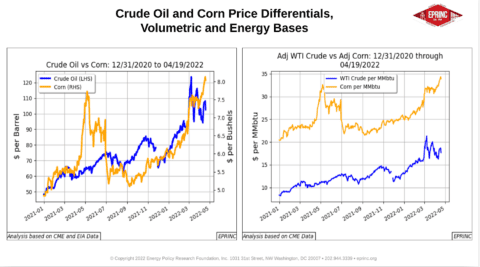
Energy Value of Ethanol vs Gasoline
On a volumetric basis ethanol may appear price-competitive with gasoline, but adjusting for its lower energy content per gallon narrows…
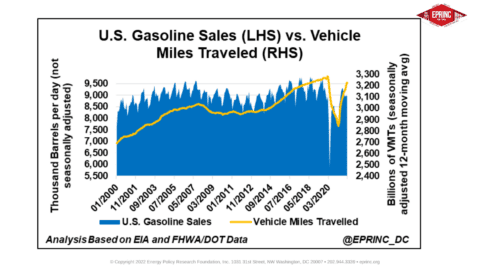
U.S. Gasoline Sales vs. Vehicle Miles Travelled
Historical trends in U.S. gasoline sales are examined alongside vehicle miles travelled to assess the relationship between fuel demand and…
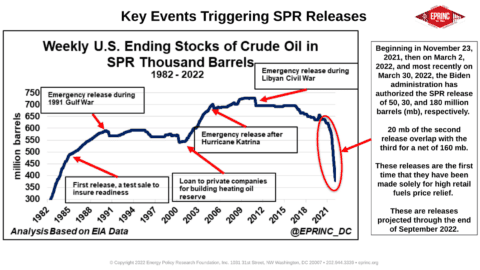
Seeking Gasoline Price Relief Through Strategic Petroleum Reserve Sales (Revised)
Beginning November 23, 2021, and continuing on March 2 and March 30, 2022, the Biden administration authorized Strategic Petroleum Reserve…
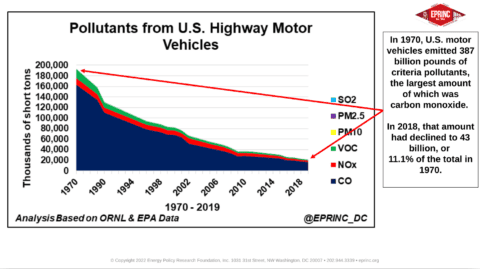
U.S. Motor Vehicle Pollution Reduction Progress since 1970
Criteria pollutant emissions from a comparable passenger vehicle have fallen dramatically since 1970, from roughly 1,500 pounds to one ton…