
Chart of the Week
A new chart every week.

Long-Term Underinvestment in Upstream Oil & Gas Production Foreshadows High Prices as Global Demand Returns
Annual financial reports from several major oil and gas companies indicate that upstream capital expenditures have remained low despite rising…

Fast Charging Electric Vehicle Stations Some Considerations
EV charging infrastructure, measured by the number of stations and fast chargers, remains concentrated in a limited set of states,…

High-Level Analysis of the Contribution of US Shale Gas to European Gas Prices and Savings
EPRINC estimates that the contribution of US shale gas to European gas prices has resulted in a total savings for…

Incremental Growth in Natural Gas Production Since 2010
From the rise of the Shale Revolution in 2010 until the onset of COVID-19 in 2020, the United States accounted…

Natural Gas Prices are Signaling Tight Energy Markets Ahead of Winter
Regional natural gas benchmarks have risen considerably in 2021, signaling concern about tight energy markets ahead of the winter heating…

Select Residential Electricity Prices U.S. and Europe
This week's chart compares select residential electricity prices in the United States and Europe, drawing on Eurostat's bi-annual data on…

With High LNG Benchmark Prices, Some Asian Electricity Producers Are Considering Alternative Fuels
Elevated LNG benchmark prices are prompting some Asian electricity producers to evaluate alternative fuels for power generation.

California Retail Gasoline Prices vs the U.S.
California retail gasoline prices consistently exceed the national average, reflecting the state's distinct fuel specifications, taxes, and regulatory environment.

Mexico Field Outage
A recent fire at Ku-Maloob-Zaap, PEMEX's largest producing field and the source of 44% of Mexico's oil output, temporarily halted…

Total U.S. Annual Potential Solar Electricity Generation
Using EPA's Green Power Equivalency Calculator conversion factors, one American football field covered with photovoltaic panels—including end zones—generates an estimated…
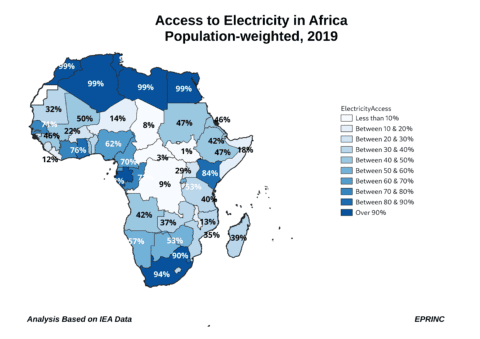
Access to Electricity in Africa
Access to electricity across Africa remains uneven, with substantial disparities in electrification rates among countries on the continent.
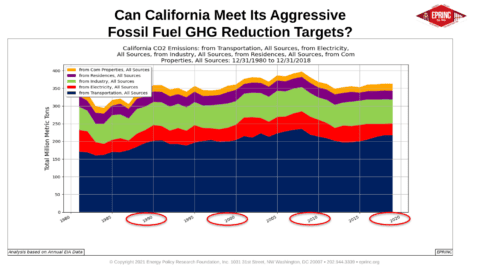
Can California Meet Its Aggressive Fossil Fuel GHG Reduction Targets?
California has established aggressive targets for reducing greenhouse gas emissions from fossil fuels, raising questions about whether the state can…
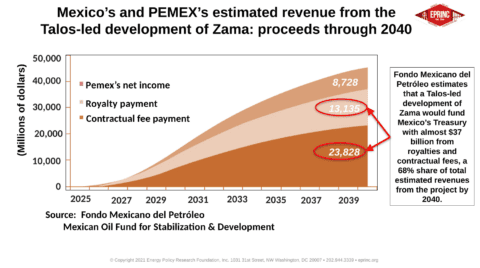
Talos-led estimated revenue from the development of Mexico’s Zama field: Proceeds through 2040
Drawing on estimates from Mexico's Fondo Mexicano del Petróleo, the chart shows that a Talos-led development of the Zama field…
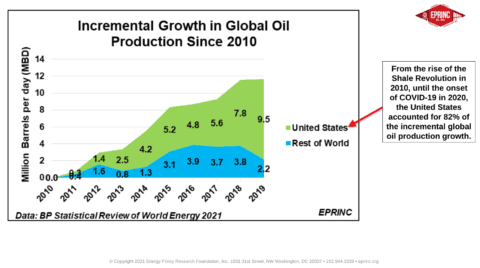
Incremental Growth in Global Oil Production Since 2010
From the rise of the Shale Revolution in 2010 until the onset of COVID-19 in 2020, the United States accounted…
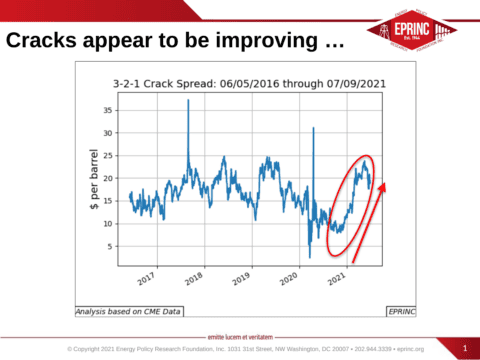
Cracks appear to be improving …
Refining crack spreads appear to be recovering, suggesting improving margins across the sector.
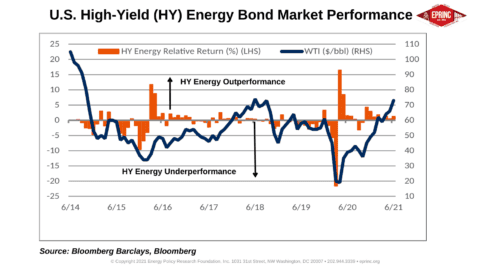
U.S. Energy Debt Market: A Look at High-Yields
The U.S. high-yield energy bond market has moved through distinct periods of outperformance and underperformance relative to the broader high-yield…
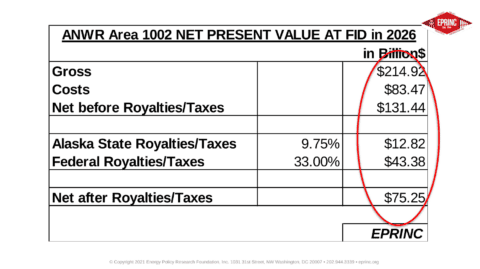
The Arctic National Wildlife Refuge Crude Oil Potential: An NPV Assessment
This assessment examines the crude oil potential of the Arctic National Wildlife Refuge through a net present value (NPV) framework.
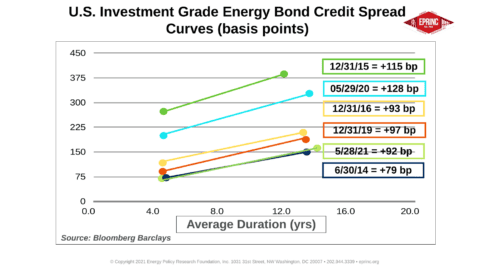
U.S. Energy Debt Market Snapshot
U.S. investment grade energy bond credit spreads have narrowed to +92 basis points as of May 28, 2021, down from…