
Chart of the Week
A new chart every week.
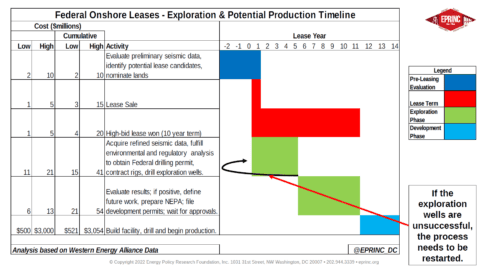
Federal Onshore Leases: Exploration & Potential Production Timeline
The timeline illustrates that federal onshore lease development is a multi-stage process, and if exploration wells prove unsuccessful, the process…
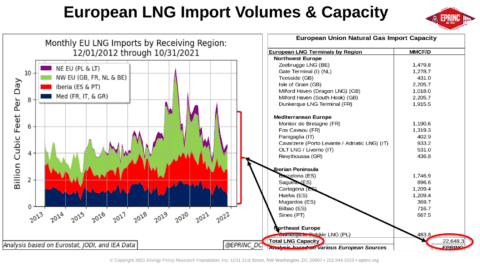
European LNG Import Volumes and Capacity
European LNG import volumes remain below available regasification capacity, indicating that existing infrastructure provides room for additional imports.
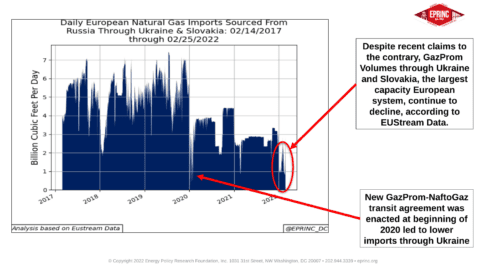
Are GazProm’s Natural Gas Volumes Increasing Through Ukraine and Slovakia as Some Claim?
Contrary to recent claims of rising flows, GazProm's natural gas volumes transiting Ukraine and Slovakia—the largest-capacity European system—continue to decline,…
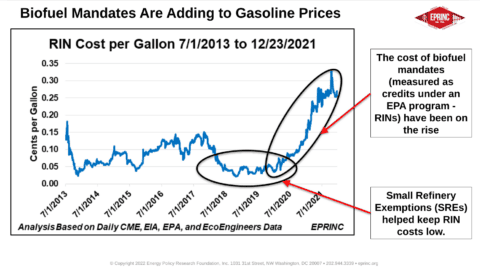
The Renewable Fuel Standard and Gasoline Prices
Small refinery exemptions previously helped hold down the cost of Renewable Identification Number (RIN) credits, but these compliance costs under…
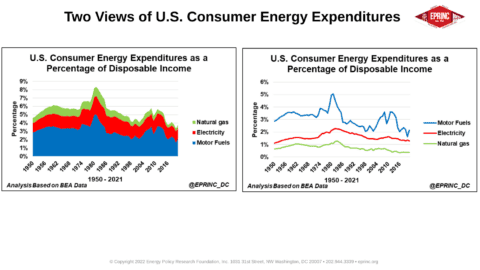
U.S. Consumer Energy Expenditures as a Percentage of Disposable Income
Consumer energy expenditures measured as a share of disposable income provide a useful metric for assessing the relative burden of…
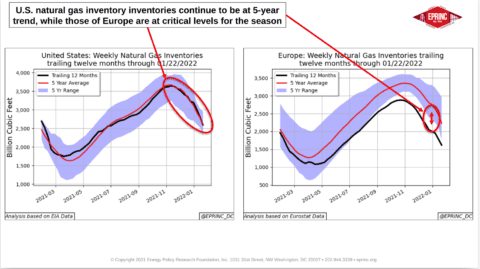
Winter of 2021-2022: Natural Gas Inventories in the Northern Latitudes – Mid-Season Update
U.S. natural gas inventories remain in line with the 5-year trend for this point in the winter season, while European…
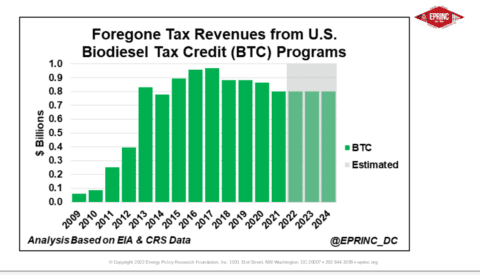
Foregone Tax Revenues from U.S. Federal Biodiesel Tax Credits
The federal biodiesel tax credit results in foregone tax revenues for the U.S. Treasury, the magnitude of which varies with…
Onshore vs Offshore U.S. Royalties from Oil & Natural Gas Production
Federal royalties from onshore oil and natural gas production have increasingly outpaced those derived from offshore production, reflecting a shift…
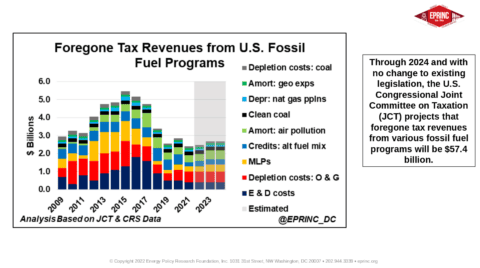
Foregone Tax Revenues from U.S. Fossil Fuel Development
Through 2024, and assuming no change to existing legislation, the U.S. Congressional Joint Committee on Taxation projects that foregone tax…
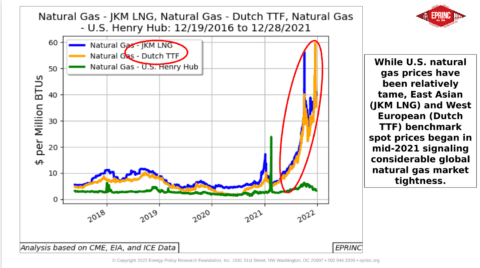
China Surpasses Japan in LNG Imports
For the first ten months of 2021, China imported 64.5 million metric tons of LNG against Japan's 61.4 million metric…
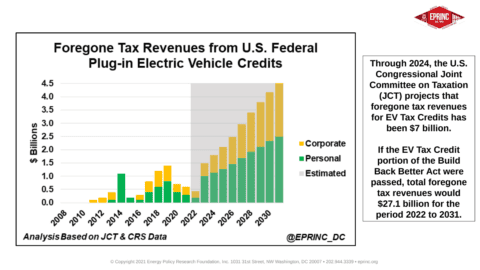
Foregone Tax Revenues from U.S. Federal Plug-in Electric Vehicle Tax Credits
Through 2024, the U.S. Congressional Joint Committee on Taxation projects foregone tax revenues from federal plug-in electric vehicle tax credits…

Foregone Tax Revenues from U.S. Federal Renewable Electricity Investment Tax Credits
The U.S. Congressional Joint Committee on Taxation projects that foregone tax revenues from federal renewable electricity investment tax credits will…

Foregone Tax Revenues from U.S. Federal Renewable Electricity Production Credits
Through 2024, the U.S. Congressional Joint Committee on Taxation projects that foregone federal tax revenues from renewable electricity production tax…

New Mexico Royalties
New Mexico's royalty rates generate revenue from oil and gas production on state lands, contributing to the state's fiscal resources.

Seeking Gasoline Price Relief Through Strategic Petroleum Reserve Sales
The Biden administration's November 23, 2021 release of 50 million barrels from the Strategic Petroleum Reserve marks the first explicit…

Natural Gas Inventories Ahead of Winter in the Northern Latitudes 2021-2022
As winter approaches in the Northern Hemisphere, U.S. natural gas inventories have built at trend, while European inventories have fallen…

Lithium and U.S. Motor Vehicle Concerns
The growing adoption of electric vehicles in the United States raises questions regarding lithium supply, an essential input for battery…

Fertilizer: Where Natural Gas and Agriculture Meet
Since 2013, the prices of natural gas, anhydrous ammonia, and corn have moved in close correlation. Beginning in 2021, the…