
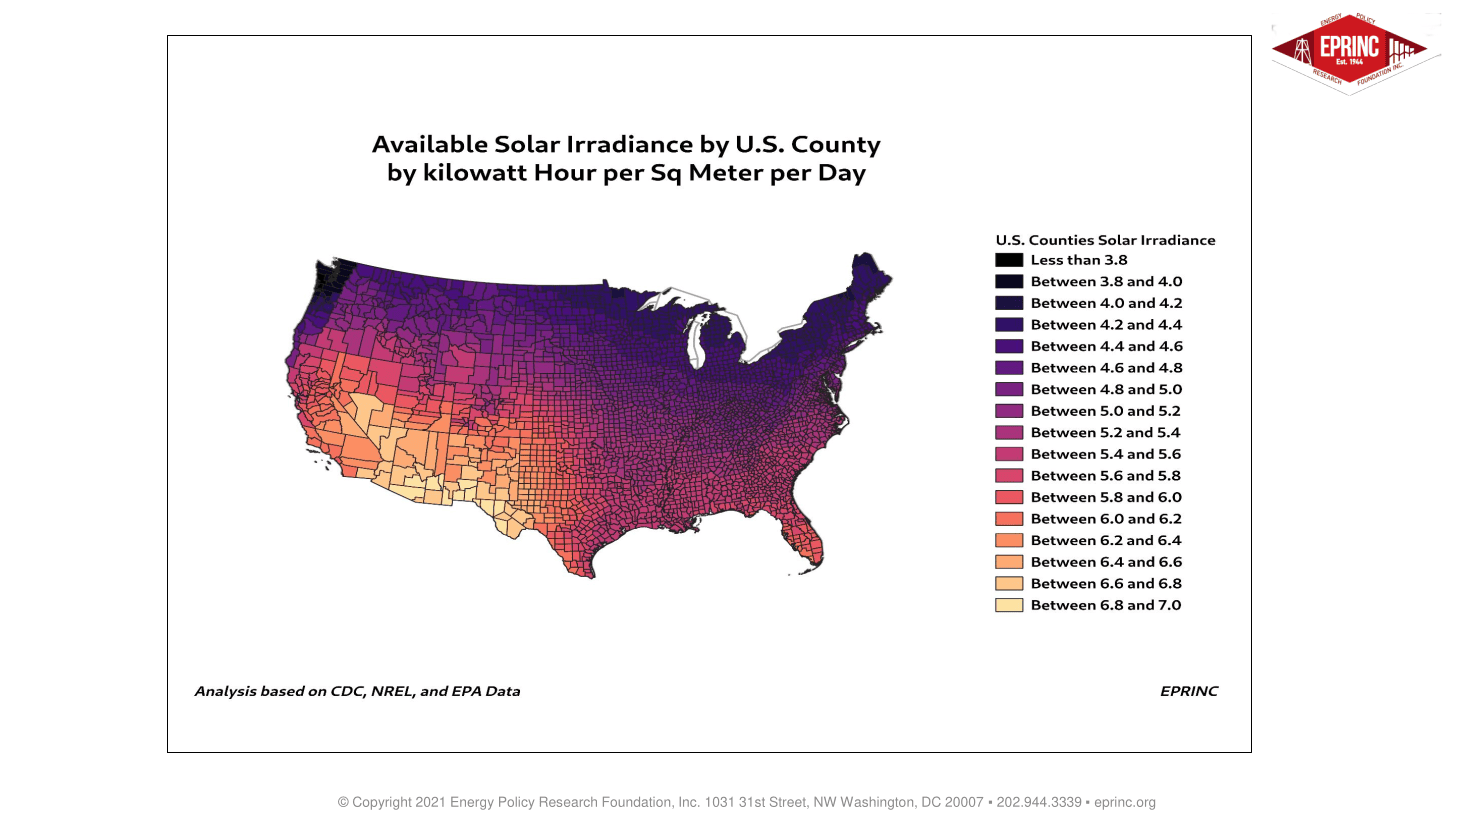
The chart draws on the conversion factors published in the U.S. Environmental Protection Agency’s Green Power Equivalency Calculator, which translate quantities of electricity generation (in kilowatt-hours) into a set of common physical equivalents. These benchmarks allow a given volume of green power to be expressed in terms of homes powered, wind turbines running, electric-vehicle miles driven, or land area covered by solar panels.
For solar, the calculator estimates the annual output of one American football field—including end zones—fully covered with photovoltaic panels. The output follows the standard equation E = A × r × H × PR, using factors developed in consultation with the National Renewable Energy Laboratory (NREL) and its Annual Technology Baseline and PVWatts tools:
- Area (A): 5,353.36 m² (109.7 m × 48.8 m, the area of a football field including end zones)
- Panel efficiency (r): 15.2%, for distributed commercial PV at an average mid-resource location (Kansas City, MO)
- Annual solar radiation (H): 1,839.6 kWh/m²/year for the same location
- Performance ratio (PR): 86%, reflecting 14% system losses
Multiplying these factors yields an estimated 1,287,336 kWh of electricity generated annually by one football field of solar PV. The other equivalents in the calculator rest on comparable references: the average American household consumed 10,649 kWh in 2019, an average U.S. wind turbine (2.43 MW nameplate capacity at a 34.98% capacity factor) generates about 7,446,123 kWh per year, and a fully electric vehicle averages roughly 34 kWh per 100 miles.
These conversion factors reflect conservative best estimates drawn from EIA, DOE, and NREL data. They are intended to make abstract generation figures more intelligible, and provide a consistent basis for scaling potential solar output against the physical footprint required to achieve it.
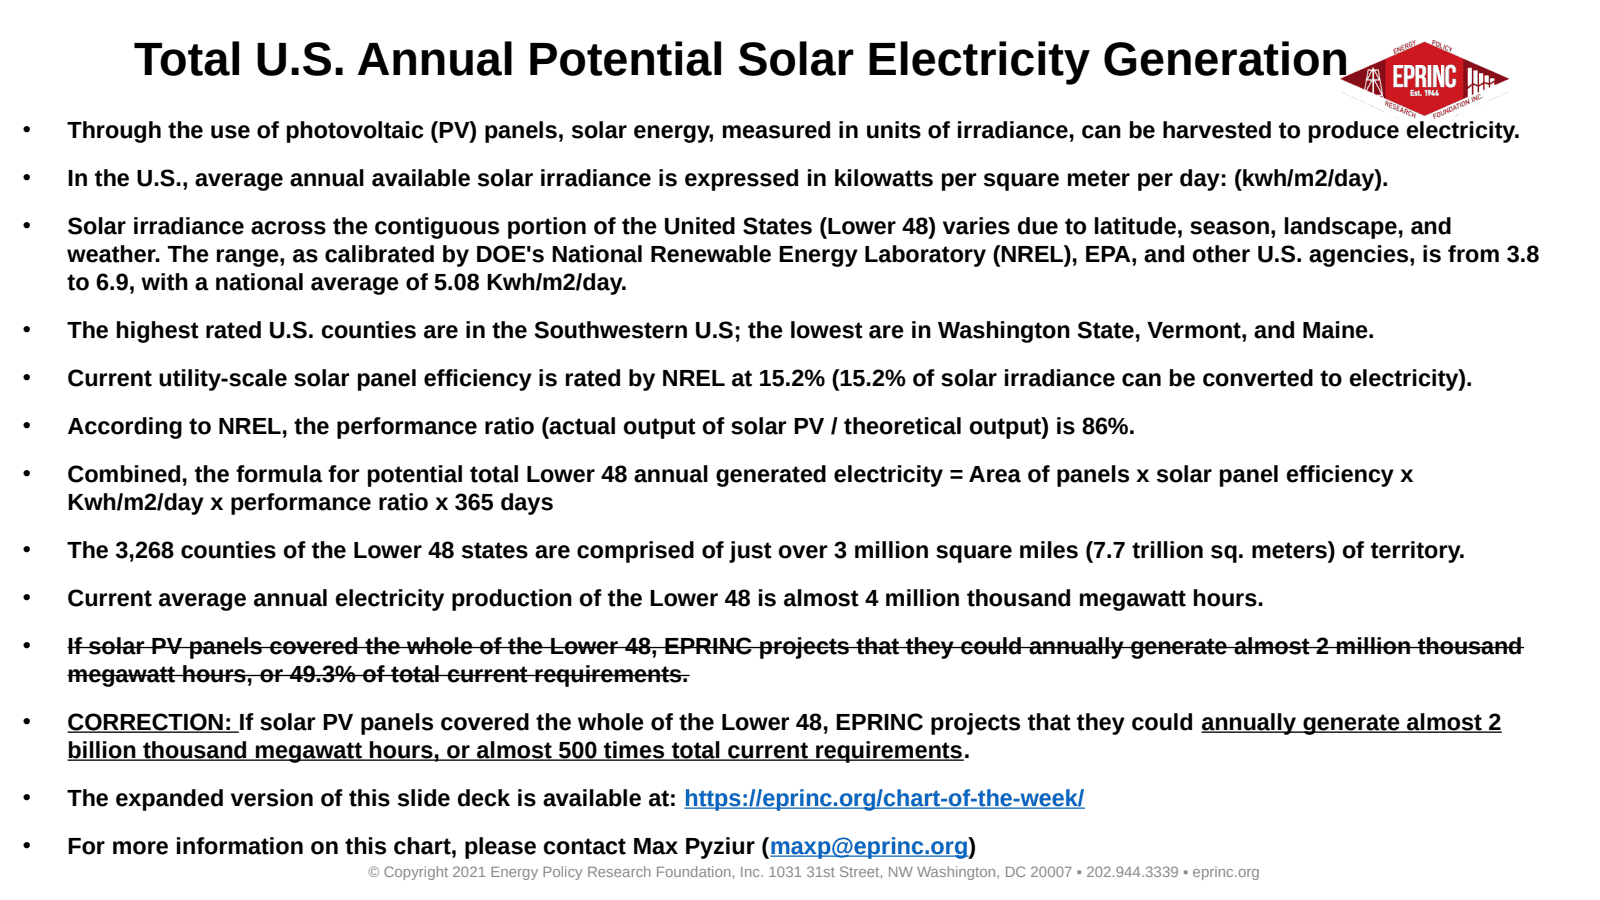
From the EPRINC Chart of the Week archive.
Cite: EPRINC, “Total U.S. Annual Potential Solar Electricity Generation,” Chart of the Week 24, September 1, 2021.