
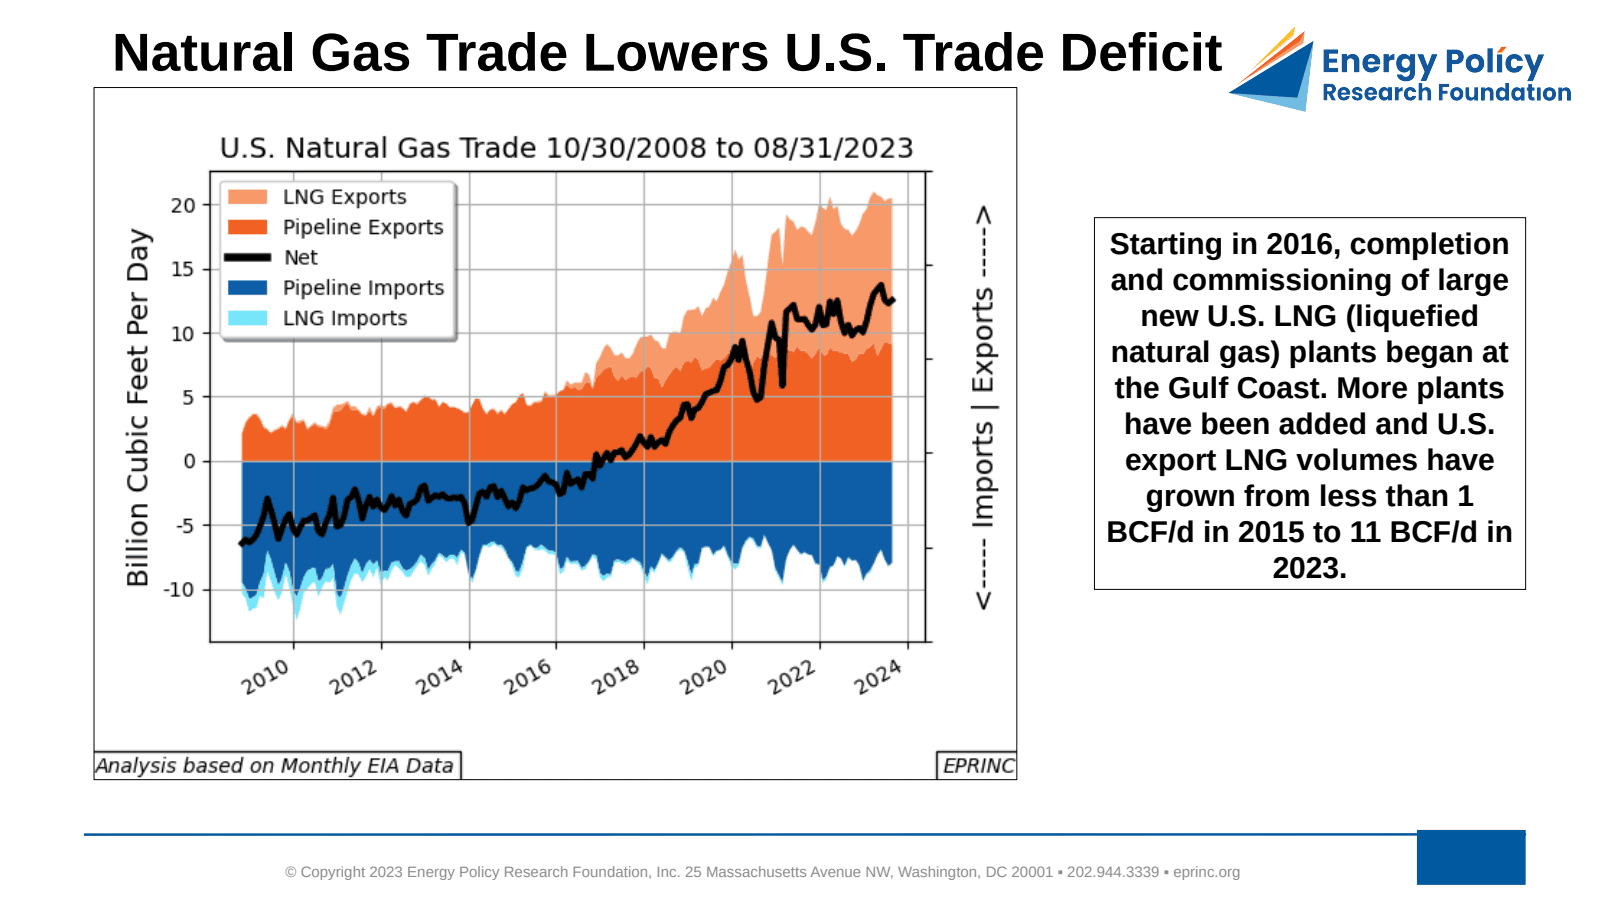
Beginning in the 2000s, new production technologies transformed the U.S. natural gas position, shifting the country from a net importer to a net exporter starting in 2017. Total net exports rose from -6 BCF/d in 2009 to 12.5 BCF/d in August 2023. Figure 1 traces the components of this change.
The shift is visible across all trade channels. Pipelined imports, all from Canada, declined modestly from 10 BCF/d to 7.5 BCF/d, while pipelined exports, primarily to Mexico, climbed from 2.5 BCF/d in 2009 to 9 BCF/d in 2023 — leaving the U.S. a net exporter of pipelined gas of about 1.5 BCF/d. Meanwhile, large new LNG plants commissioned along the Gulf Coast beginning in 2016 lifted export volumes from less than 1 BCF/d in 2015 to 11 BCF/d in 2023.
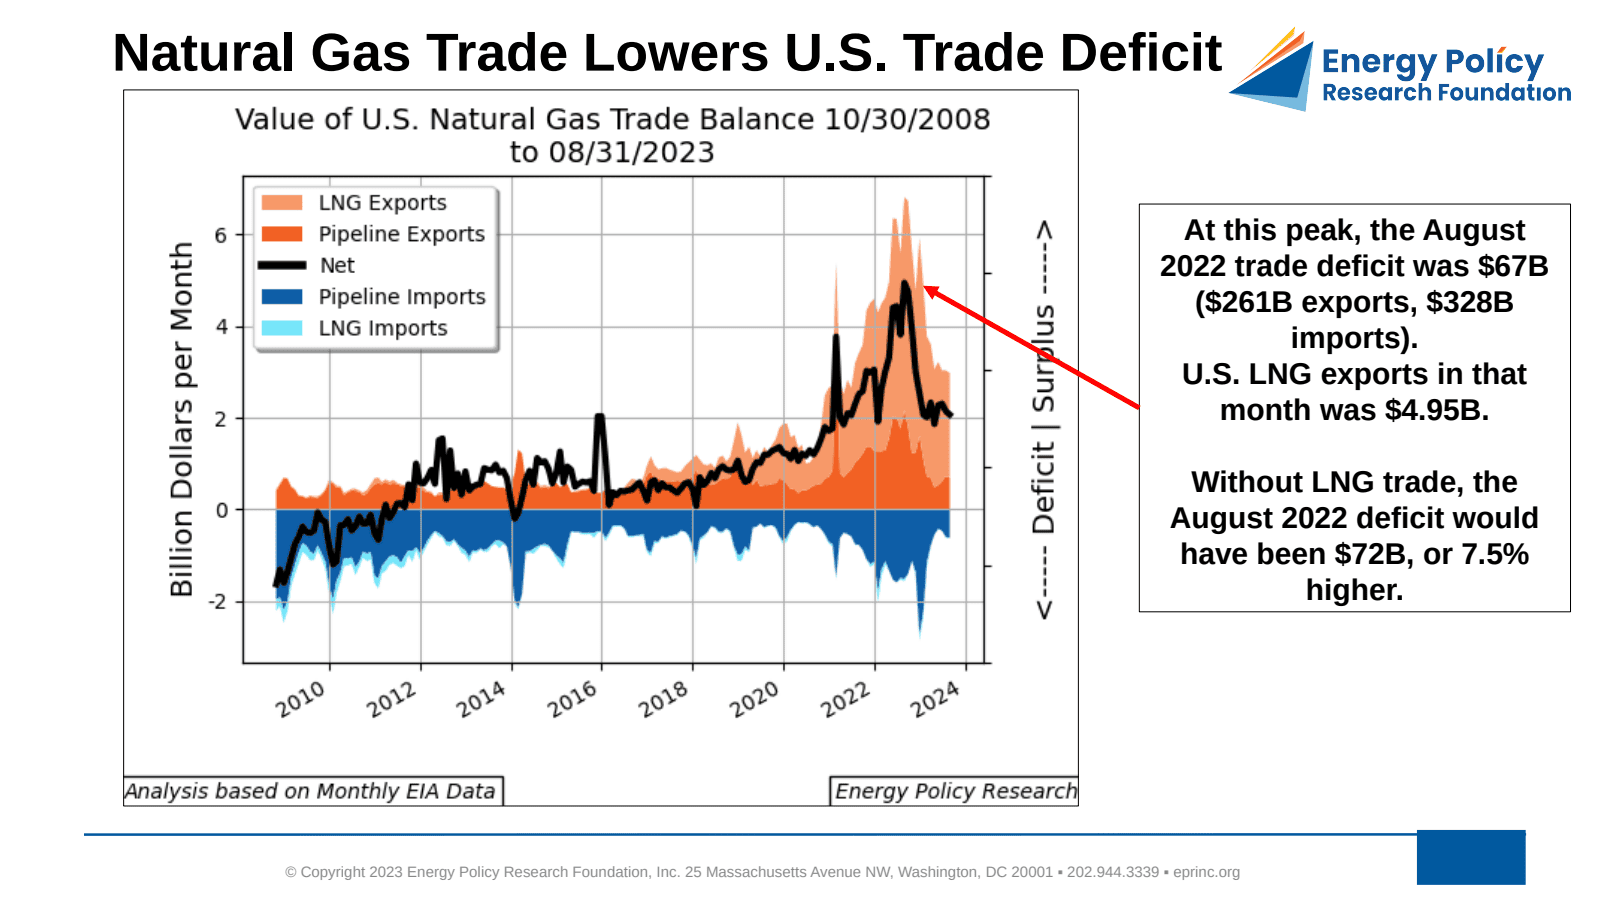
These net exports have made a positive contribution to the U.S. trade balance. The value of monthly U.S. natural gas trade turned from negative to positive in mid-2011 and has continued to rise since. As shown in Figure 2, the monthly natural gas trade surplus peaked at $4.95 billion in August 2022. That month, the U.S. trade deficit in goods and services stood at $67 billion ($261 billion in exports against $328 billion in imports); without natural gas trade, the deficit would have been $72 billion, or 7.5% higher.
Although the contribution is modest, it is material. While negative imbalances persist elsewhere, the positive trajectory for U.S. natural gas trade is structural and should continue to mitigate the trade deficit over the long term.
From the EPRINC Chart of the Week archive.
Cite: EPRINC, “Natural Gas Trade Lowers U.S. Trade Deficit – Revised,” Chart of the Week 2023-45, November 6, 2023.