
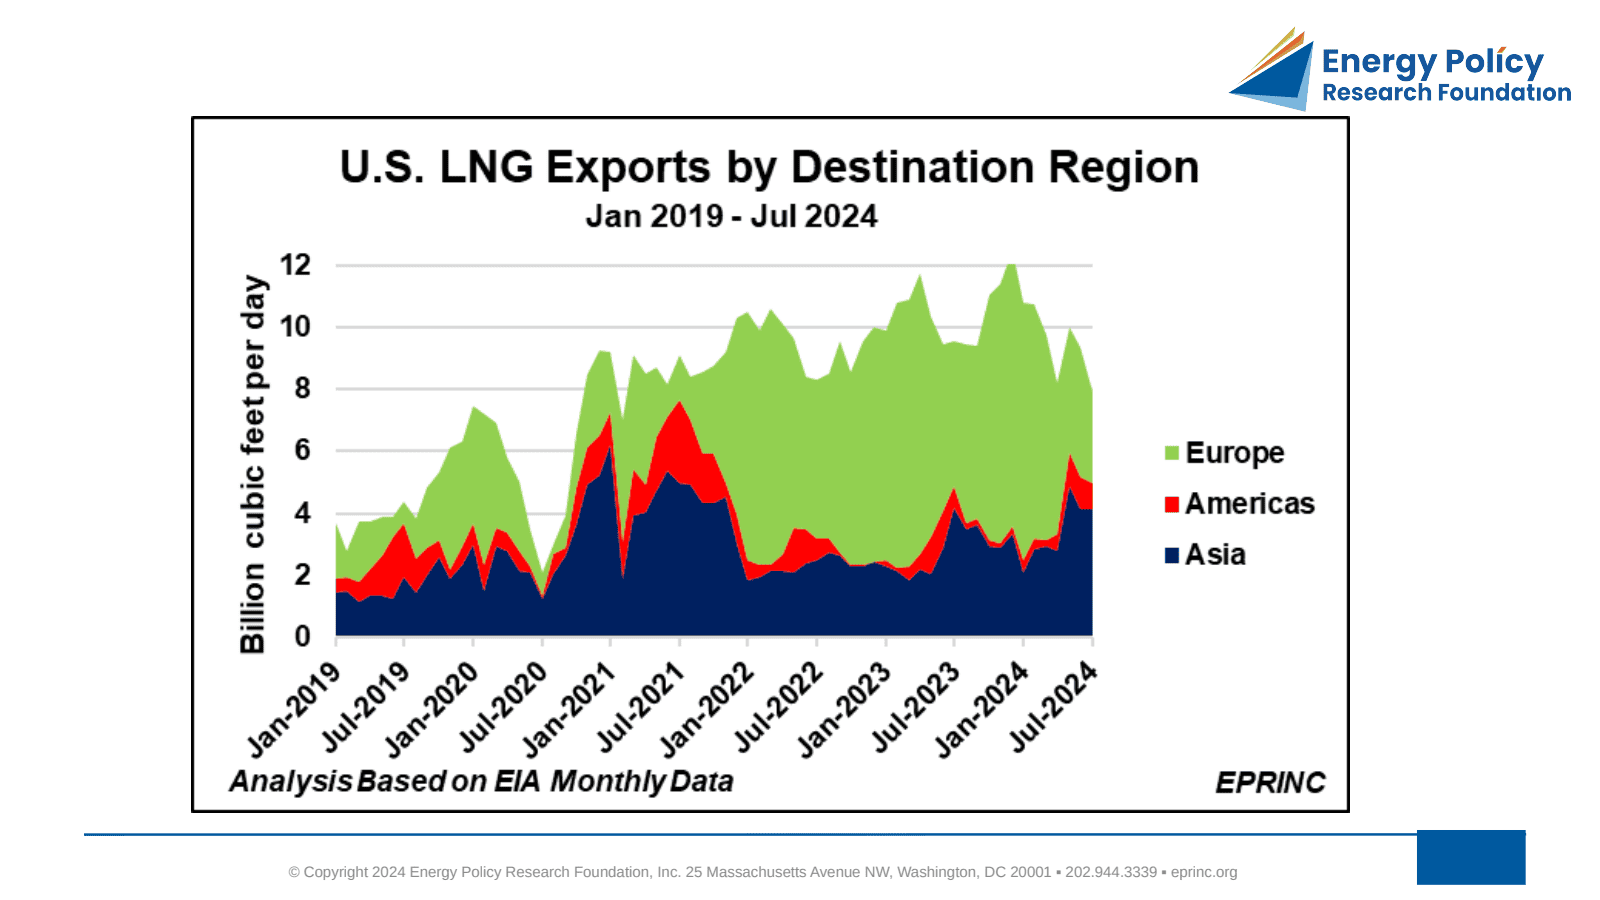
The chart tracks U.S. LNG exports by destination region. In 2021, Asia was the dominant market, purchasing over 4.5 BCF/d, or roughly 50% of U.S. LNG exports, while Europe and the Americas accounted for about 3 and 1.5 BCF/d, respectively.
Two developments reversed this pattern. Ahead of winter 2021-2022, European natural gas inventories stood well below the five-year average, with Russia’s GazProm-owned, Germany-based Astora storage at just 25% of capacity rather than the usual 70%. Then, as Russia’s war against Ukraine escalated in 2022 and a series of reciprocating measures followed, flows of pipelined Russian natural gas to Europe were severely curtailed.
In response, close to fifty U.S. LNG cargoes—about 100 billion cubic feet—were diverted to Europe, on top of volumes arriving from Qatar, Nigeria, and Algeria. During 2022 and 2023, Europe imported 71% (6.7 BCF/d) and 70% (7.3 BCF/d) of total U.S. LNG exports. Asia ranked second, taking 24% (2.3 BCF/d) in 2022 and 27% (2.9 BCF/d) in 2023.
A mild winter and ample inventories reduced European demand in 2024, with U.S. LNG imports averaging 5.5 BCF/d. The U.K., Italy, and Spain have imported less U.S. LNG, only partially offset by rising German imports. Even so, Europe has taken almost 60% of U.S. LNG exports so far in 2024.
From the EPRINC Chart of the Week archive.
Cite: EPRINC, “U.S. LNG Exports by Destination Region Revisited,” Chart of the Week 2024-41, October 7, 2024.