
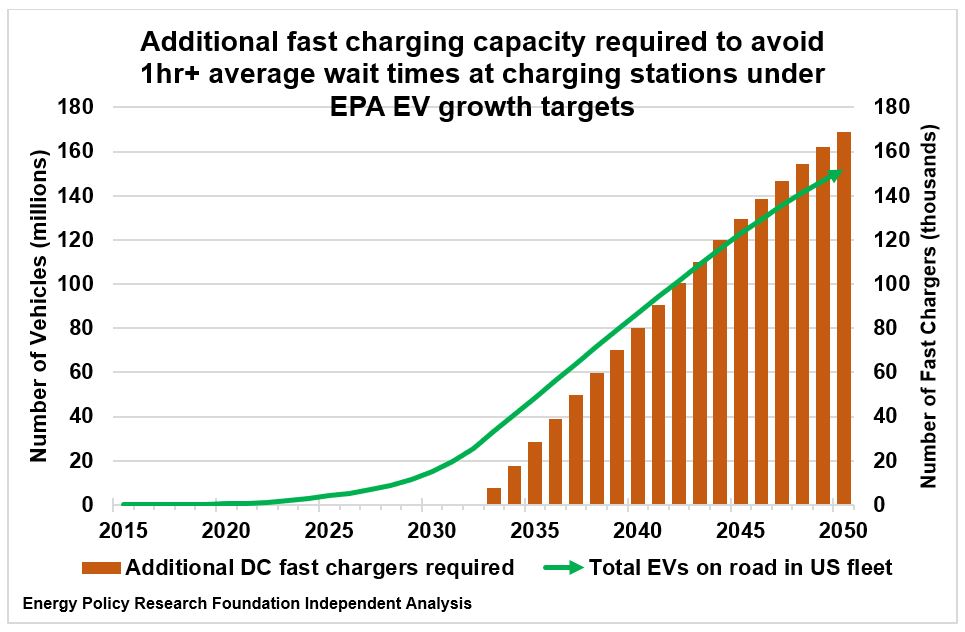
The recent EPA rule announced by the Biden administration to reduce Corporate Average Fuel Economy (CAFE) CO2 emission standards to half their current level by 2032 will require automakers to expand the share of electric vehicles (EVs) in their fleets in coming model years. This chart examines whether the nation’s charging infrastructure can keep pace with that mandated growth.
The United States currently has around 7,700 fast charging stations, each with roughly five DC fast charging ports, typically located along highways to support cross-country travel. This is sufficient for the limited EV share of the 2024 fleet — about 1 percent — but would be quickly overwhelmed under the EPA rule’s growth targets. By 2032, when new EVs are projected to outnumber new internal combustion engine vehicles entering the fleet, wait times would approach one hour if no additional charging stations are built. This breaking point occurs when EVs reach 10 percent of the total operating fleet.
To keep wait times under one hour, the average utilization of the charging network must remain below 70 percent, leaving at least 30 percent of ports free at any given time. Above that threshold, wait queues grow exponentially, with drivers frequently facing lines of several vehicles, each requiring about half an hour to charge.
To avoid this over-utilization, EPRINC’s analysis finds that roughly 169,000 new DC fast charging ports — about five times the current number — would need to be built by 2050 at EV growth rates consistent with the EPA targets. At a minimum installation cost of about $20,000 per port, the total exceeds $3.4 billion, though the split between government funding and private investment remains unclear.
These figures may represent a lower bound. Projected average wait times do not capture variance, and drivers may find even low-probability events that produce highly inconvenient waits unacceptable, implying that still more chargers could be required. This chart and analysis draw on a forthcoming EPRINC report, Electric Vehicles vs Internal Combustion Engines: An Energy Economic Analysis.
From the EPRINC Chart of the Week archive.
Cite: EPRINC, “Potential for Charging Station Deficiency Under EPA’s Electric Vehicle (EV) Expansion Program,” Chart of the Week 2024-26, June 24, 2024.