
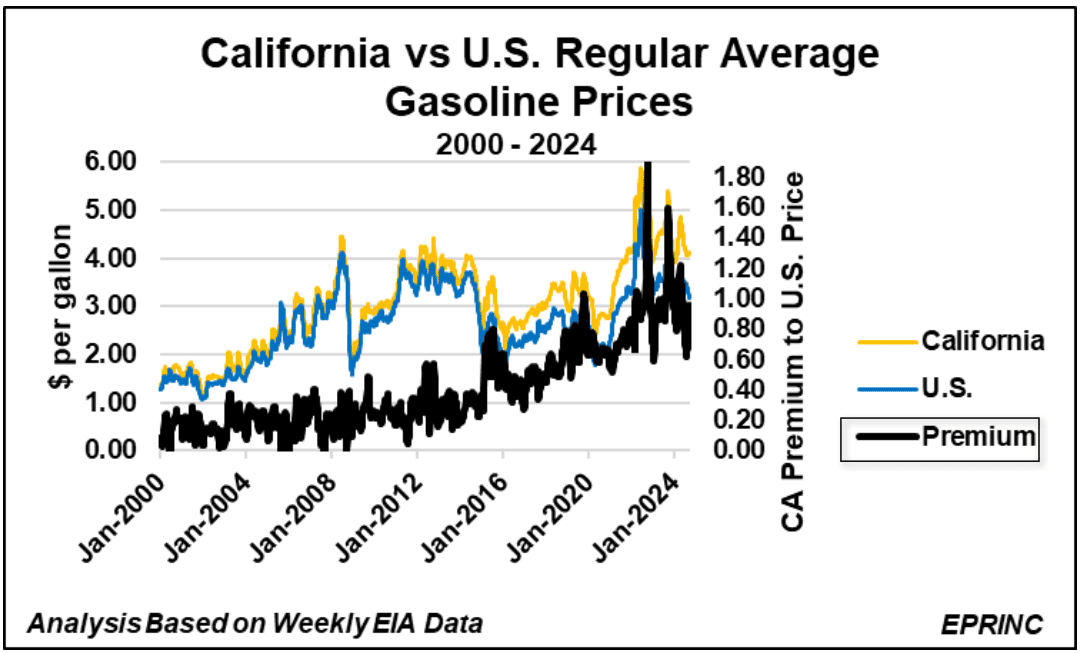
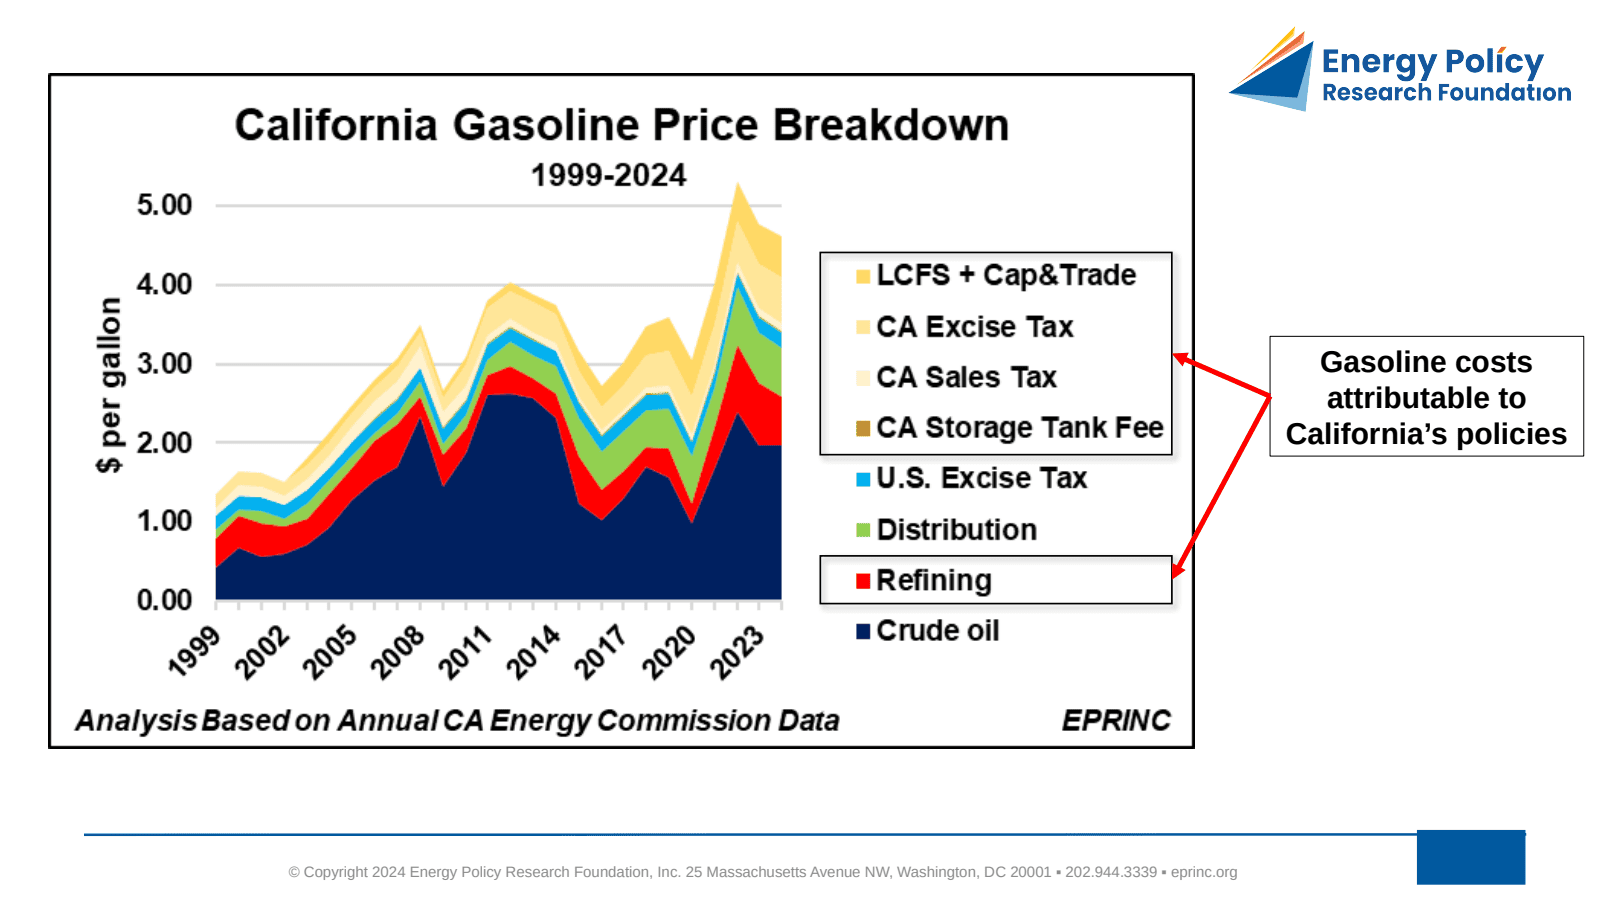
California’s gasoline price has historically run above the national average, a gap this Chart of the Week attributes to a combination of state-specific policies layered on top of federal requirements. Beginning with California’s aggressive moves to contain motor vehicle pollution in the 1960s, state authorities targeted gasoline formulations as one channel for mitigation. Because California sought to exceed national EPA requirements, it stipulated its own fuel specification—commonly referred to as CARBOB (California Air Resources Blendstock for Oxygenate Blending). The only source for CARBOB is California in-state refiners, and by the early 2000s this formulation alone made California gasoline about 16 cents per gallon higher than the U.S. average.
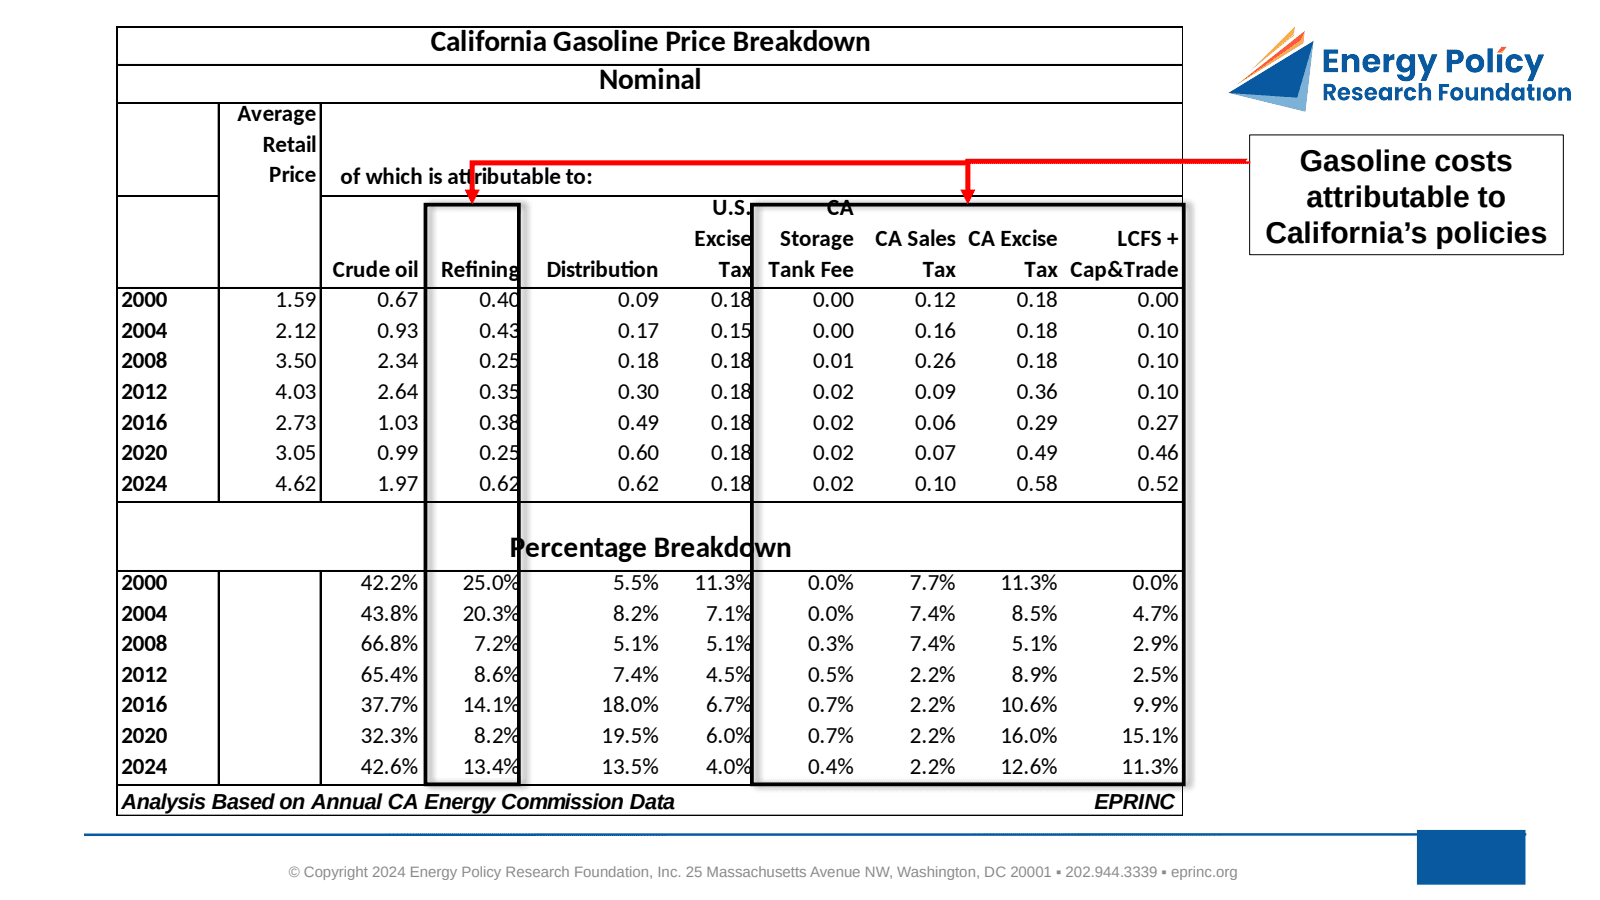
Two subsequent environmental programs added further cost. AB32, signed into law in 2006, mandated California’s Cap & Trade program, the state’s primary policy for reducing greenhouse gas emissions. In 2011, California implemented its Low Carbon Fuel Standard (LCFS). Together these programs raised California’s gasoline prices by an additional 10 cents per gallon in 2004 and by an additional 52 cents per gallon in 2024.
The state’s excise tax has also risen sharply, from 18 cents per gallon in 2000 to 58 cents per gallon in 2024.
Combined, these factors pushed California’s premium over the national gasoline price to an average high of about $1 per gallon during 2022 and 2023, with an all-time peak of $1.91 per gallon on October 3, 2022. Through 2024, the premium has averaged 90 cents per gallon.
As EPRINC Research Director Max Pyziur noted, some of California’s programs have been effective while others remain contentious and questionable; regardless, they have added substantial cost to the state’s price of gasoline. Further detail is available through EPRINC’s Chart of the Week.
From the EPRINC Chart of the Week archive.
Cite: EPRINC, “Breakdown of California Gasoline Prices,” Chart of the Week 2024-39, September 23, 2024.