
Chart of the Week
A new chart every week.
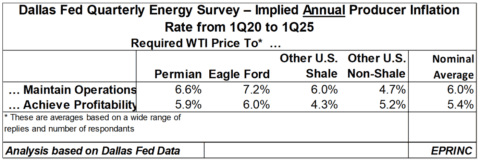
Dallas Fed Survey: U.S. Crude Oil Production Costs Are Rising – Revisited
The Dallas Fed's energy survey shows the average WTI price U.S. producers need to maintain operations has risen from just…
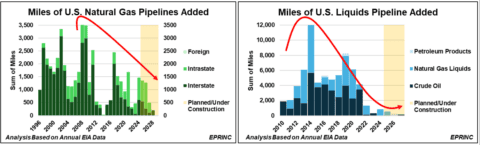
Abatements to Additional U.S. Pipeline Capacity Could Challenge Future Growth in U.S. Energy Production and Exports
New pipeline additions have slowed sharply since their late-2000s and mid-2010s peaks, and projections through 2030 show minimal planned capacity…
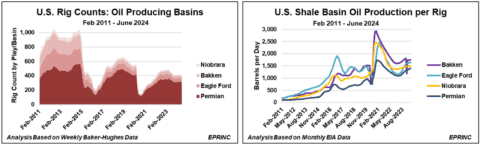
Measuring Productivity Improvements in U.S. Shale Oil and Gas Production
As fracking technology and data acquisition have advanced, the productivity of U.S. shale wells has risen dramatically—Appalachian natural gas wells…
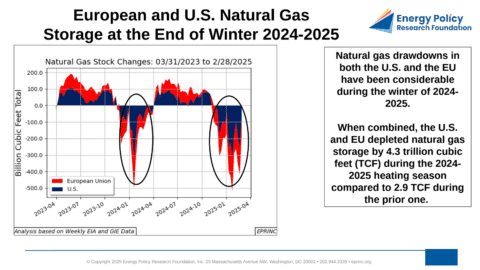
European and U.S. Natural Gas Storage at the End of Winter 2024-2025
A colder winter in 2024-2025, particularly during February, drove combined U.S. and EU natural gas storage drawdowns to 4.3 trillion…
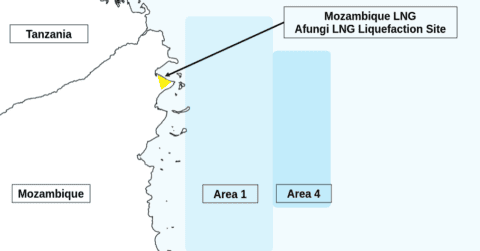
Mozambique LNG and the Role of The U.S. Export-Import Bank
The Mozambique LNG project, a $20 billion-plus onshore export facility, awaits its largest single source of financing—$4.7 billion from the…
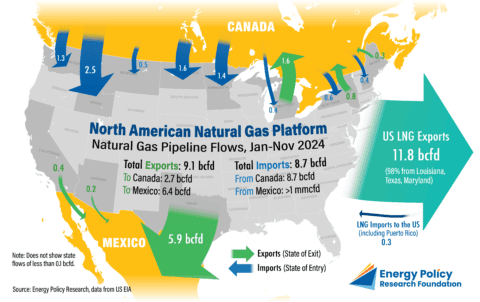
North American Natural Gas Platform: Natural Gas Pipeline Flows, Jan-Nov 2024
Natural gas pipeline flows across North America during the first eleven months of 2024 illustrate the continued integration of the…
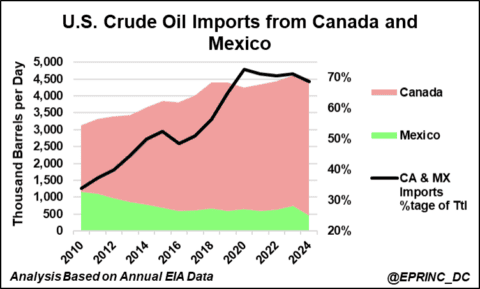
The Cost Impact of President Trump’s Tariffs on U.S. Crude Oil Imports from Canada and Mexico: A First Assessment
Applying the tariff rates set out in President Trump's February 1, 2025 Executive Orders, the added annual cost of U.S.…
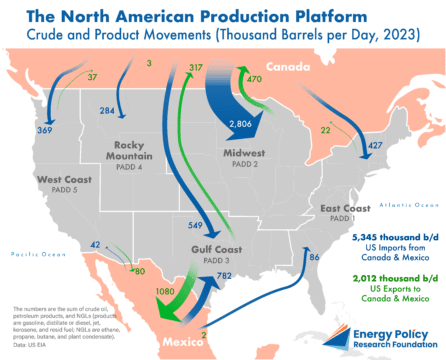
Crude Oil and Product Movements: The North American Production Platform
The chart maps the crude oil and refined product flows that integrate the U.S., Canadian, and Mexican energy markets, showing…
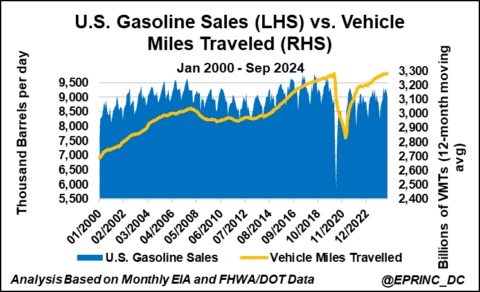
U.S. Gasoline Sales, Vehicle Miles Traveled, and Motor Vehicle Fuel Efficiency Revisited
U.S. gasoline consumption grew only 0.25% annually between 2000 and 2022, yet vehicle miles traveled rose nearly 1% per year…
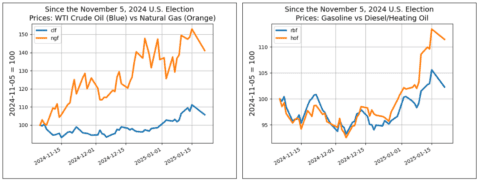
Impacts of the U.S. 2024 Presidential Election on Petroleum and Natural Gas Equities
Since the 2024 U.S. Presidential Election, crude oil and natural gas prices have diverged, with natural gas equities rising on…
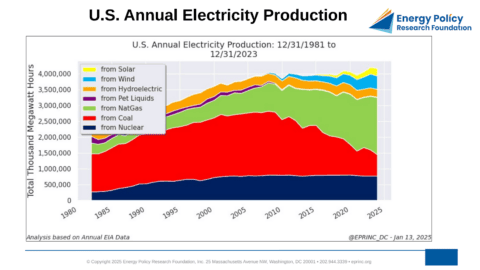
U.S. Electricity Production and Prices The Long View
Since 1981, U.S. electricity production has moved through two epochs: annual growth of 2.4% from 1981 to 2002, then a…
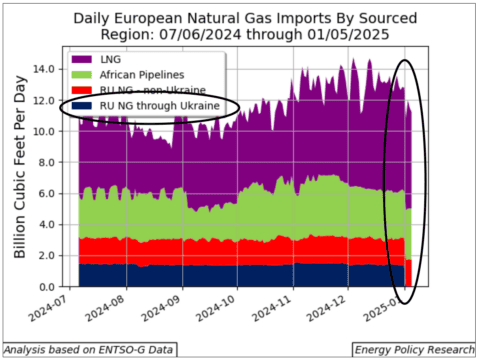
European Natural Gas Constraints During the Winter of 2024-2025
On January 1, 2025, Ukraine halted the flow of pipelined Russian natural gas to the EU as the 2019 five-year…

Iranian Petroleum Exports Under Shifting U.S. Sanctions Regimes
Iranian petroleum exports have rebounded to roughly 1.5 million barrels per day amid lax enforcement and skillful sanctions evasion, and…

The German Duck Curve Evolution of Germany’s Mid-Summer Electricity Generation Resource Mix Comparing 2017 and 2024
Germany's mid-summer electricity mix now displays a pronounced "Duck Curve," as midday utility-scale solar output displaces other generation while the…

Tesla Automotive Credits And Gross Profit
Automotive regulatory credits—sold to manufacturers that fall short of government EV standards—have contributed roughly 10 to 30 percent of Tesla's…

U.S. Data Centers: A Provisional Summary in Two Tables
Drawing on newly collected facility-level data, EPRINC counts 2,602 operating U.S. data centers in 2024, with another 139 under construction…

U.S. Utility-Scale Battery Storage Developments
U.S. utility-scale battery storage capacity has grown from 1,570 MW in 2020 to 20,710 MW in 2024, an annualized rate…

Virginia Electricity Demand Growth: The Case of Data Centers
In 2023, Virginia data centers are estimated to have consumed 32 terawatt hours of electricity—over 25% of the state's total…