
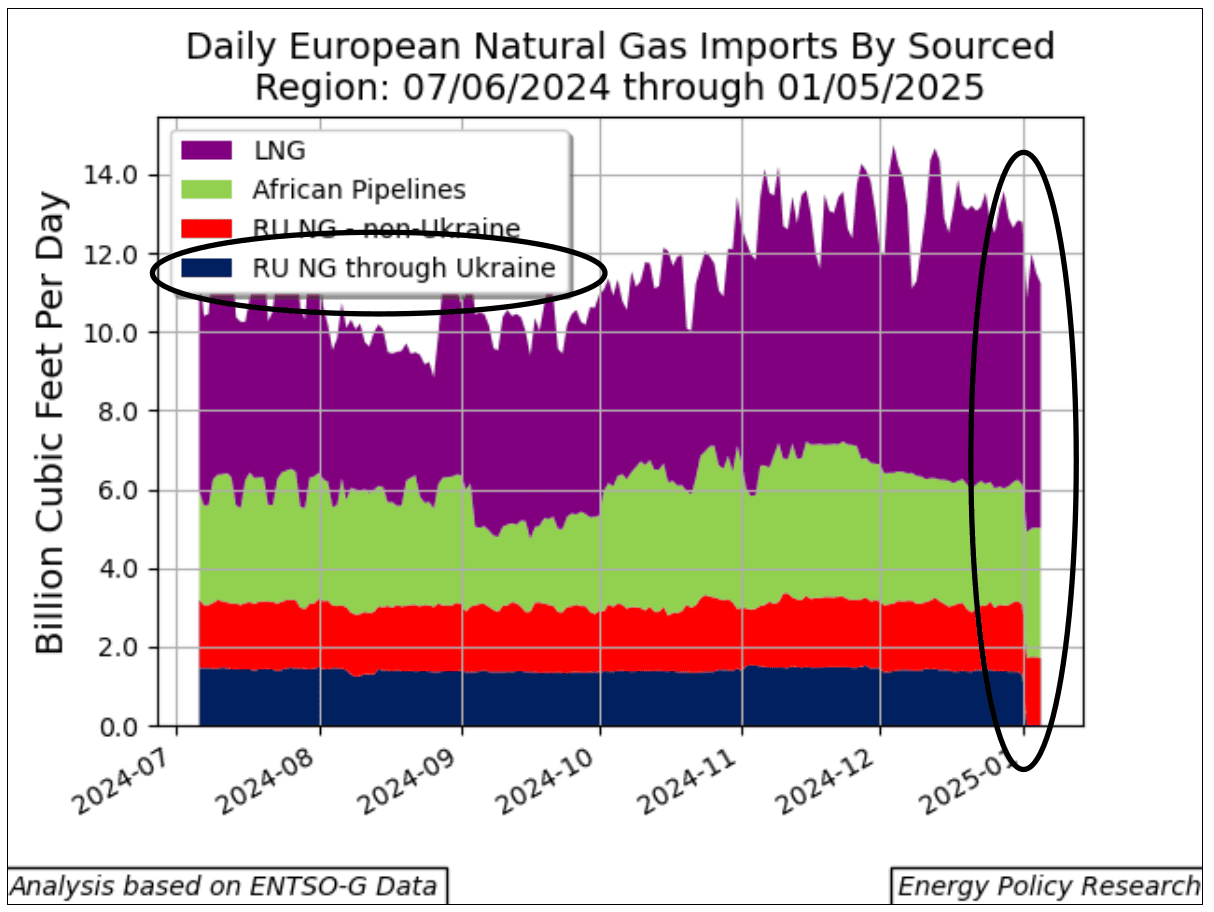
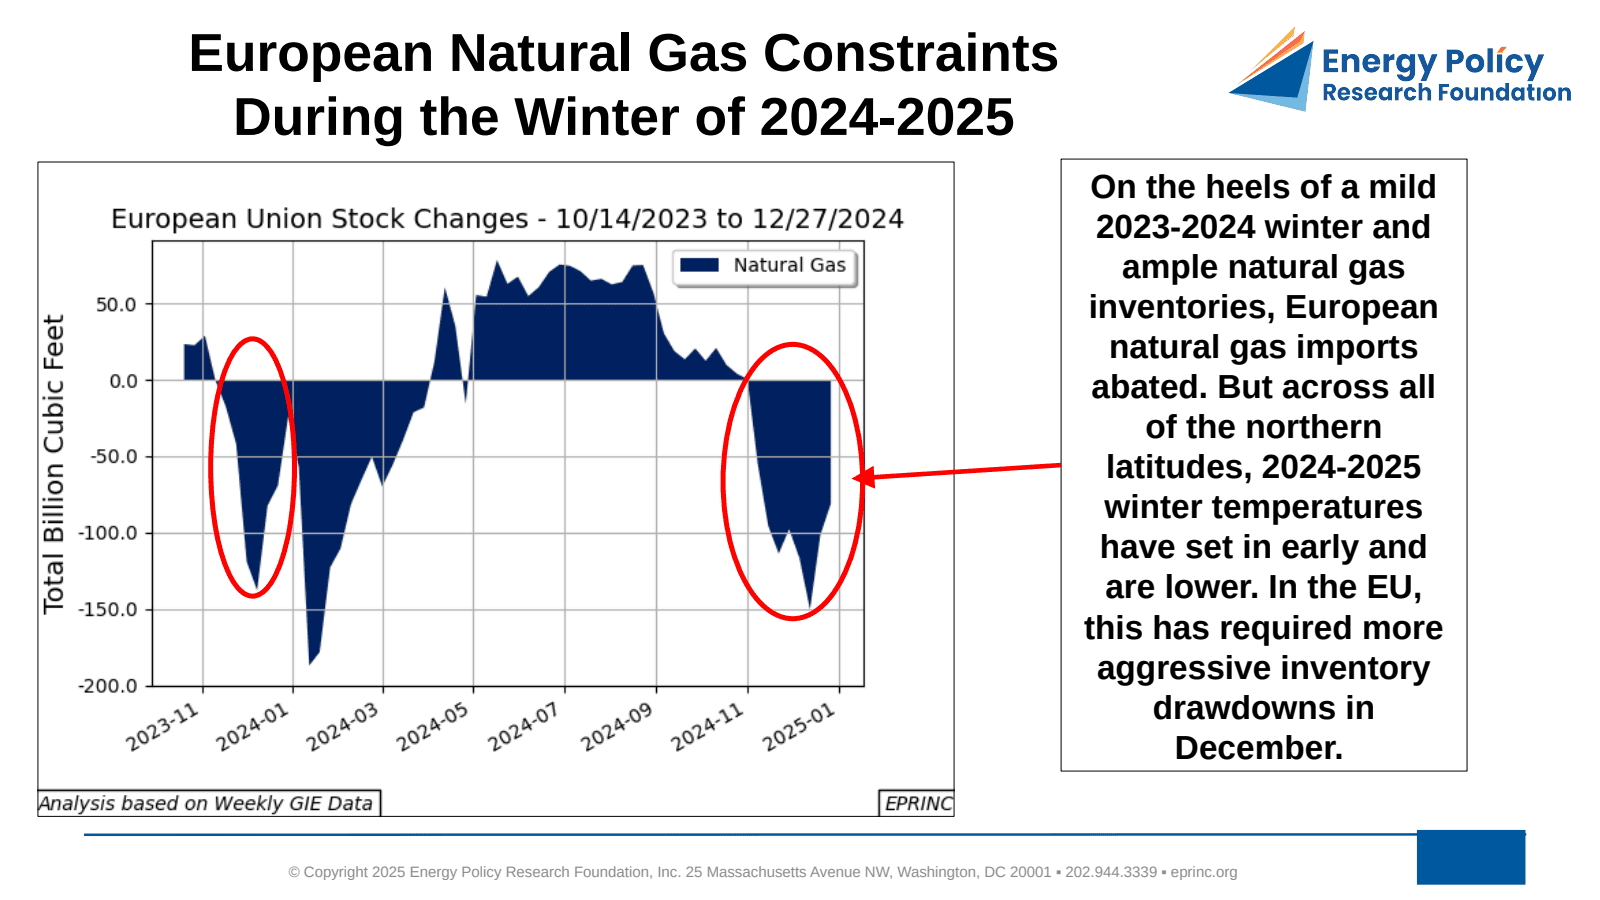
The chart tracks European natural gas supply arrangements and inventory levels heading into the winter of 2024-2025. Ukraine’s transit route carried just under 1.5 BCF/d over the prior five years, well below its transit capacity of more than 15 BCF/d. That flow ceased on January 1, 2025, when the five-year agreement negotiated in late 2019 expired without a new transit deal.
The 2019 agreement had committed Russia to a take-or-pay contract transiting a minimum of 4 BCF/d from 2021 through 2024. Following Russia’s escalation of the war against Ukraine in February 2022, actual flows held steady at about 1.5 BCF/d. Ukraine suspended transit from the Sokhranivka compressor station in May 2022, citing wartime dangers, leaving Sudzha as the sole entry point; in August 2024, Ukrainian forces occupied a substantial portion of Russia’s Kursk Oblast near Sudzha.
With the Ukrainian route now closed, Russia continues to pipeline roughly 1.5 BCF/d to Europe via the Turkstream system, which runs from Russia’s Black Sea coast near Krasnodar across the Black Sea to Kyıköy, Turkey, and on to Bulgaria. All other Russian pipeline systems have either been shut down (those through Poland) or damaged beyond repair (Nord Stream).
The EU consumes 45-50 BCF/d (465-517 BCM/y) and produces approximately 12 BCF/d (125 BCM/y), relying on storage and imports to cover the balance. After a mild 2023-2024 winter left ample inventories and eased import demand, the 2024-2025 winter set in early with temperatures lower than the prior year across northern latitudes, requiring more aggressive December inventory drawdowns. Imports from other sources have risen, notably LNG—of which the United States has recently supplied roughly 60% of the total—and African pipelined gas.
The financial stakes underscore the shift: Russia had received 7-8 billion euros annually for gas exported to Europe, while Ukraine collected about $800 million in transit fees, short of the $1.5 billion minimum stipulated in the 2019 contract.
From the EPRINC Chart of the Week archive.
Cite: EPRINC, “European Natural Gas Constraints During the Winter of 2024-2025,” Chart of the Week 2025-01, December 30, 2024.