
Chart of the Week
A new chart every week.
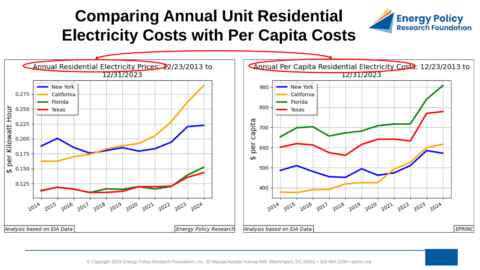
New York, California, Florida, Texas: Comparing Annual Unit Residential Electricity Costs with Per Capita Costs
Among the four most populous U.S. states, California has the highest residential electricity unit cost at 28.9 cents per kWh…
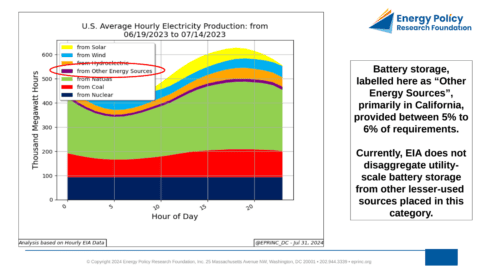
U.S. Mid-Summer Heat Wave Met by Record Natural Gas Power Generation
During the June 19–July 14, 2024 national heat wave, natural gas supplied between 38% and 52% of U.S. power requirements,…

Energy Policy Research Interactive Chart: IEA Critical Minerals Demand Growth
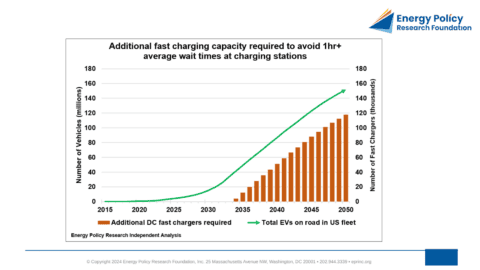
Errata: Additional DC Fast Charging Capacity Required Acceptability of EV Wait Times
An erratum revising two earlier charts finds that fewer DC fast chargers will be needed by 2050 than initially projected,…
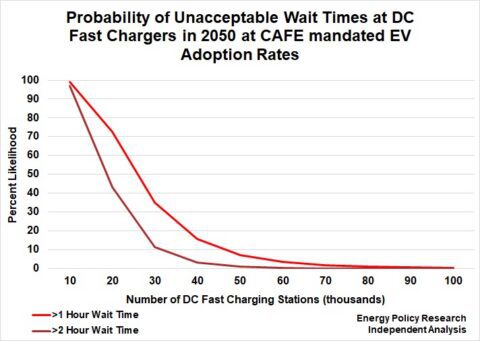
Acceptability of EV Wait Times at DC Fast Charging Locations
Even in scenarios where average EV wait times at DC fast charging stations are held under an hour, infrequent high-impact…
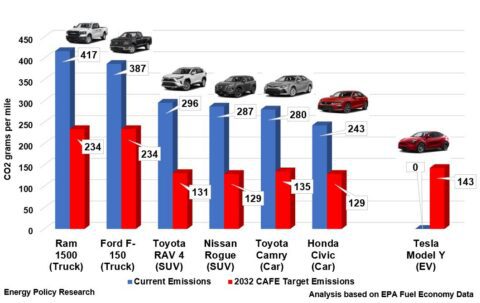
Emissions of Current Popular Vehicles and Required 2032 Compliance Levels
In March 2024, the EPA raised Corporate Average Fuel Economy (CAFE) standards to require light-duty vehicle emissions to fall to…
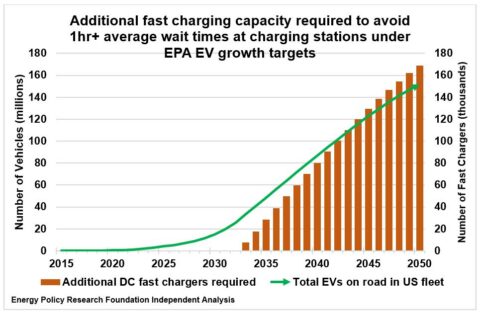
Potential for Charging Station Deficiency Under EPA’s Electric Vehicle (EV) Expansion Program
While the current U.S. network of fast charging stations is adequate for today's small EV fleet, EPRINC's analysis finds that…
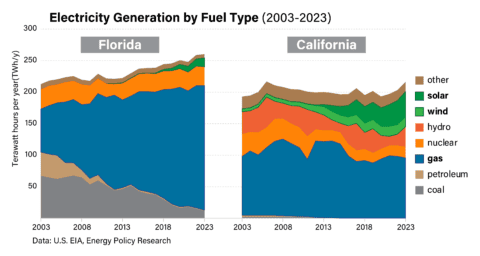
A Tale of Two States on Electricity Prices
California and Texas illustrate divergent outcomes on electricity prices, with the two states following markedly different trajectories.
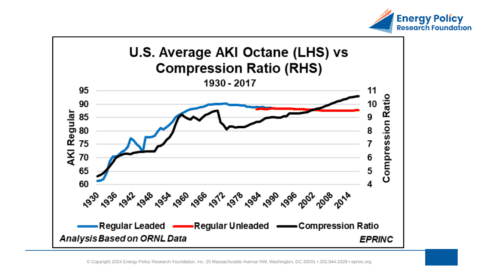
Octane vs Compression Ratio
From the 1930s through the mid-1970s, average engine compression ratios of gasoline-powered vehicles climbed from about 4-to-1 to roughly 10.5-to-1,…
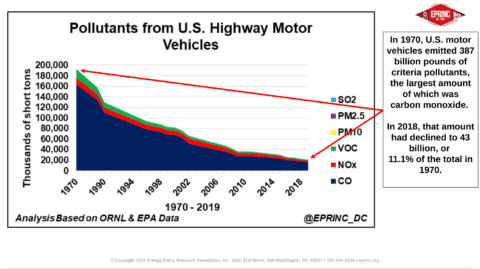
U.S. Motor Vehicle Pollution Reduction Progress since 1970
Criteria pollutant emissions from new automobiles have fallen dramatically since 1970. A 1968 Ford Mustang emitted between roughly 1,500 pounds…
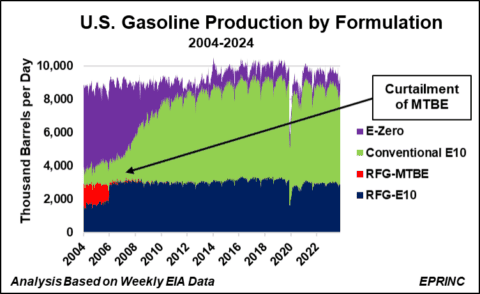
Changes in Gasoline Formulations in Response to More Exacting Pollution Standards and Blending Mandates
The chart traces the evolution of U.S. gasoline formulations over the past twenty years, showing how successively more exacting pollution…
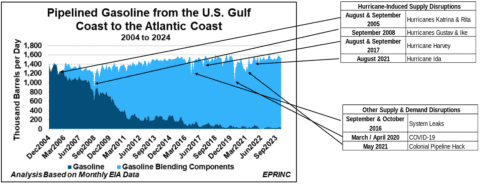
Disruptions of Pipelined Gasoline from the U.S. Gulf Coast to the Atlantic Coast
As the DOE prepares to sell down the one-million-barrel Northeast Gasoline Supply Reserve between May 27 and June 30, 2024,…
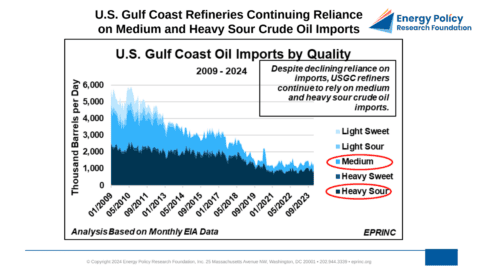
U.S. Gulf Coast Refineries Continuing Reliance on Medium and Heavy Sour Crude Oil Imports
Refineries along the U.S. Gulf Coast, which account for 55% of U.S. refining capacity and are optimized for medium and…
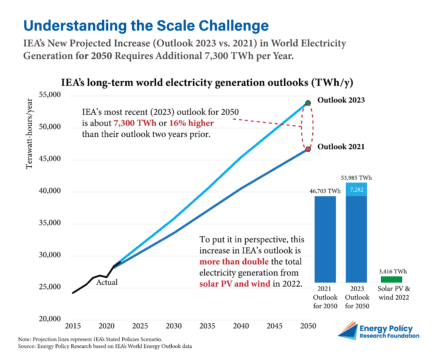
Understanding the Scale Challenge
The IEA's electricity generation outlooks for 2050 illustrate the scale of expansion required across generation sources, underscoring the magnitude of…
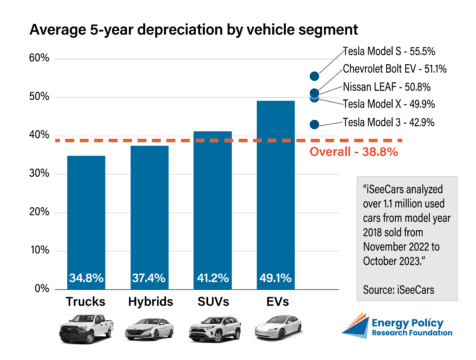
Vehicle Depreciation
Vehicle depreciation rates vary significantly across powertrain types, with implications for total cost of ownership and consumer purchasing decisions.
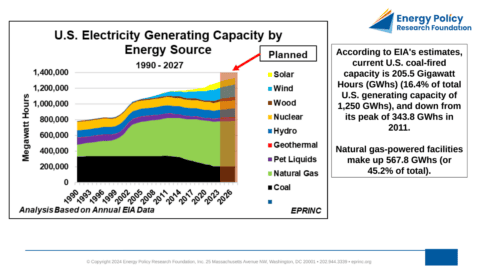
EPA’s Power Plant Rule, Declining U.S. Electricity Generating Capacity, and Growing Power Demand Have Capacity Requirements Been Underestimated in the Face…
EPA's newly finalized power plant rule would retire a substantial share of dispatchable coal and natural gas capacity even as…
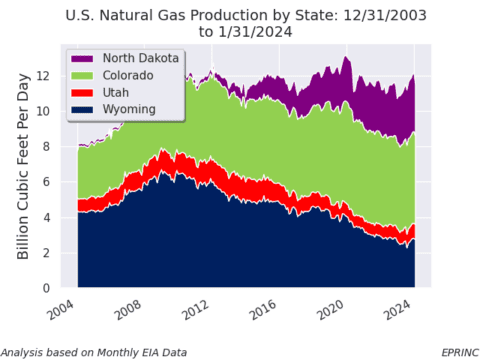
U.S. Natural Gas Production by Producing Region and State, and the Contribution of Oil & Gas Extraction to these States’ GDP
During 2023, three U.S. regions comprising 11 states produced an average of 107 BCF/d, or 95% of total U.S. marketed…
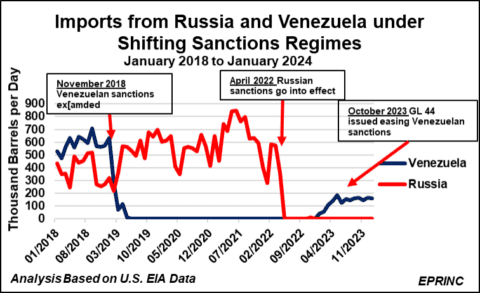
U.S. Crude Oil & Product Imports from Russia and Venezuela under Shifting Sanctions Regimes
Once a combined 1.2 million barrels per day of U.S. imports, Russian and Venezuelan crude and product flows have been…