
Chart of the Week
A new chart every week.
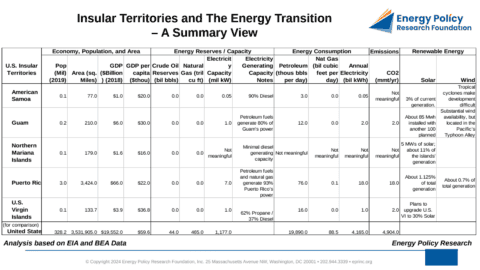
U.S. Insular Territories and The Energy Transition: A Summary View
A summary table of the five primary U.S. insular territories shows economies built largely on military bases and tourism, an…
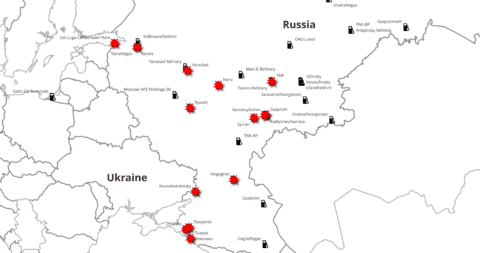
Ukrainian Strikes on Russian Refineries and Global and U.S. Product Markets
Since January 2024, Ukrainian drone strikes have damaged 14 Russian refineries and 9 terminals, impairing an estimated 1.3 mbd of…
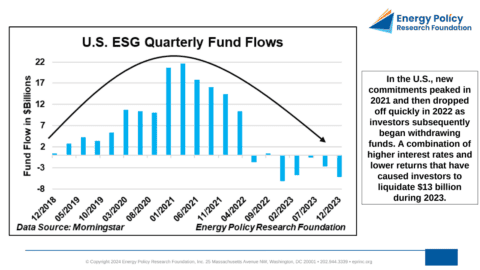
ESG Assets Under Management (AUM) Global and U.S. Perspectives
Global ESG assets under management exceeded $3.0 trillion by December 2023, up from $600 billion in March 2018, but growth…
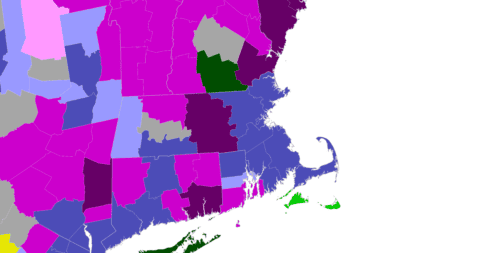
Massachusetts: Electrification Challenges in Response to Recent Legislation and Rules
A Massachusetts Department of Public Utilities order effectively mandating the decommissioning of the natural gas system and a shift to…
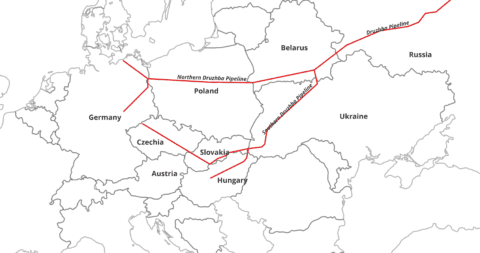
Russian Pipeline Crude Oil Exports to Central Europe: Who is Complying with the Sanctions?
Despite the EU's December 2022 ban on Russian crude oil imports, Slovakia, Hungary, and Czechia continue to receive pipeline volumes…
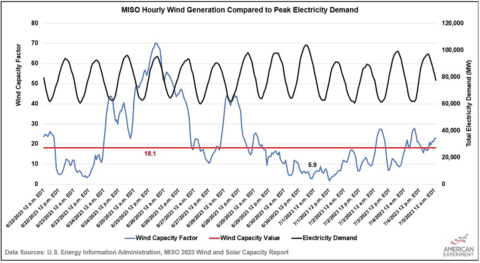
EPA’s Proposed Grid Performance Standards and Their Impact on MISO’s Electricity Grid
MISO's electricity grid depends heavily on coal and natural gas generation, with hourly data from summer and winter 2023 showing…
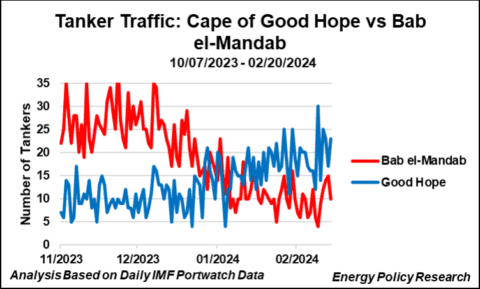
Tanker Traffic: Bab el-Mandab Strait vs Cape of Good Hope
Beginning January 4, 2024, the number of tankers routing around the Cape of Good Hope exceeded those transiting the Bab…
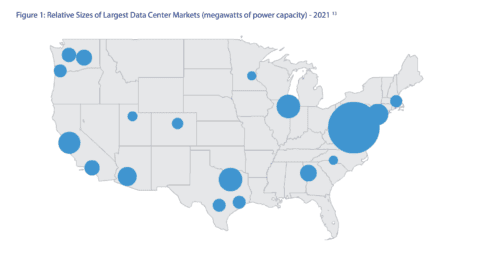
Figure 1. Relative Sizes of Largest Data Center Markets
Figure 1 compares the largest U.S. data center markets, showing that while California, Washington State, Texas, and Illinois host significant…
U.S. LNG Revisited
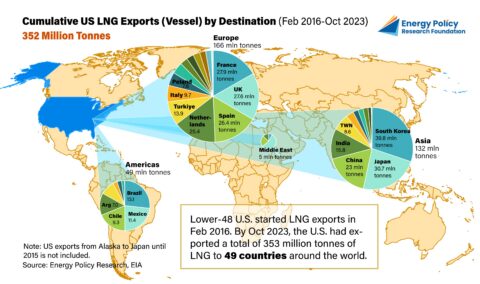
Reviewing 20 years of data, EPRINC finds the United States has exported 352 million metric tons of LNG to 49…
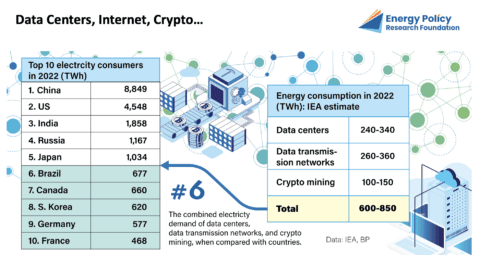
Figure 1. Energy Consumption of Data Centers, Data Transmission Networks, and Crypto Mining
The combined global electricity consumption of data centers, data transmission networks, and crypto mining has reached an estimated 600-850 TWh,…
U.S. Residential Heating by County
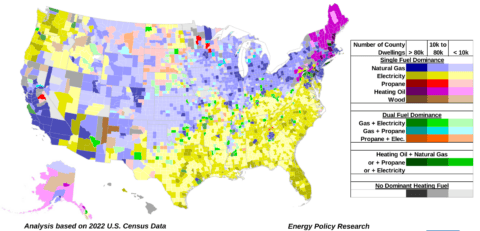
Drawing on 2022 U.S. Census Bureau county-level data, EPRINC's map identifies the dominant residential heating fuel across more than 3,150…
Unintended Consequences Of Curtailments Of USNatural Gas Production
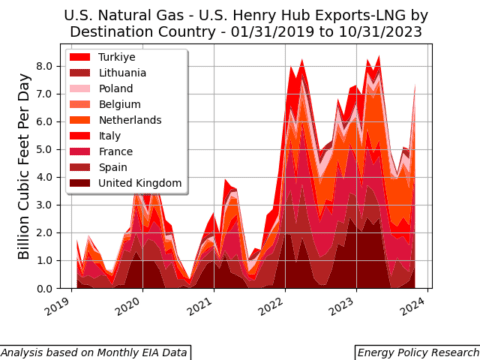
Because roughly 14% of U.S. natural gas is produced as associated gas alongside crude oil, curtailing gas output would ripple…
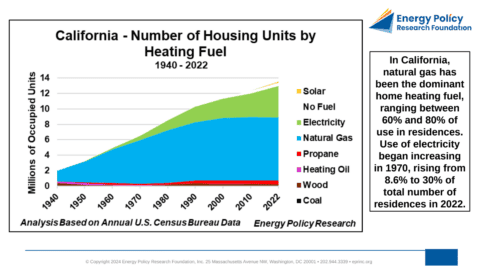
Number of Housing Units by Heating Fuel – 1940 to 2022: California, Texas, New York State
Census data on residential heating fuel from 1940 to 2022 reveal sharply different trajectories in three of the largest U.S.…
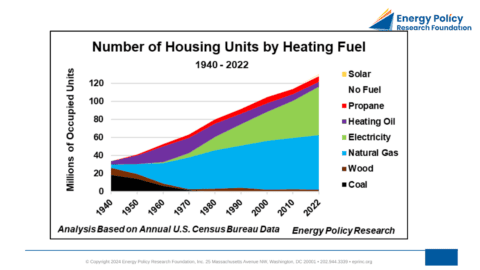
Number of U.S. Housing Units by Heating Fuel: 1940 to 2022
Since the 1970s, natural gas and electricity have displaced coal, wood, and heating oil to become the dominant fuels for…