
Chart of the Week
A new chart every week.
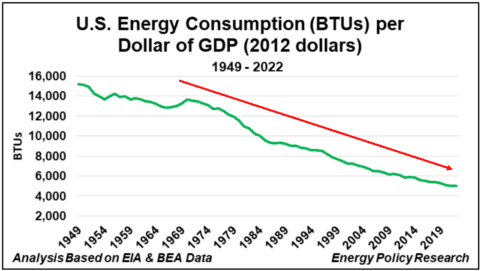
U.S. Energy Security As Measured by Efficiency
Measured as primary energy consumption per inflation-adjusted dollar of GDP, U.S. energy efficiency improved at an annualized rate of 1.5%…
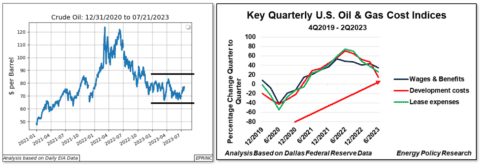
U.S. Crude Oil Production – Potential Headwinds
U.S. crude oil markets face flattening, range-bound prices and rising costs, conditions that are pulling down rig counts and slowing…
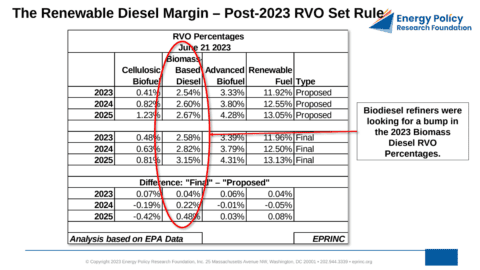
The Renewable Diesel Margin – Post-2023 RFS RVO Set Rule
Following EPA's June 21, 2023 final Renewable Fuel Standard "set" rule, which held the 2023 biomass diesel volume obligations flat…
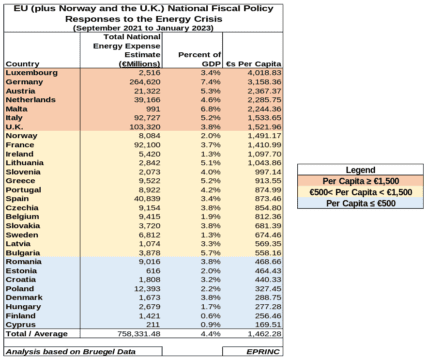
EU (plus Norway and the U.K.) National Fiscal Policy Responses to the Energy Crisis: September 2021 to January 2023
European governments committed an estimated €758 billion ($833 billion) between September 2021 and January 2023 to shield consumers from surging…
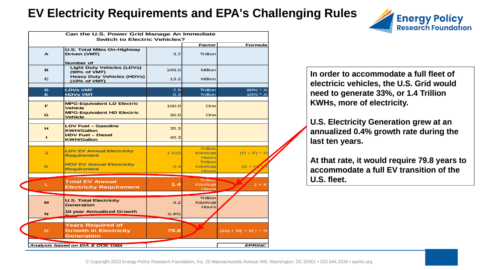
EV Electricity Requirements and EPA’s Challenging Rules
Two EPA rules proposed in 2023 work at cross-purposes: one would sharply raise electric vehicle production while the other would…
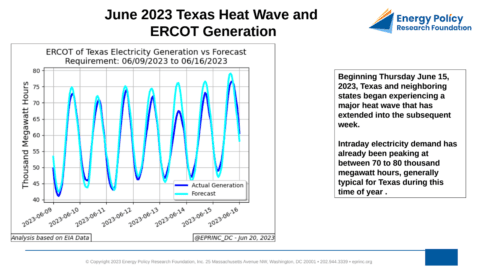
June 2023 Texas Heat Wave and ERCOT Generation
During the major heat wave that began June 15, 2023, ERCOT intraday electricity demand peaked at roughly 70,000 to 80,000…
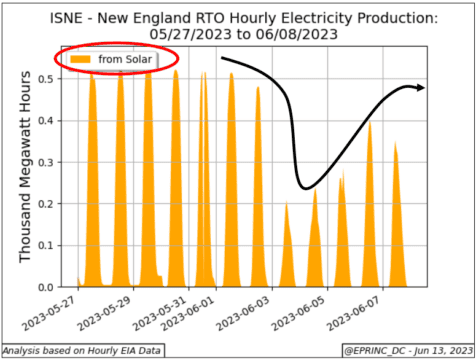
Impact from Canadian Wildfire Smoke On Solar Generation in the Northeastern U.S.
During the Canadian wildfire smoke event of June 5–8, 2023, solar generation in ISO New England fell to between 40%…
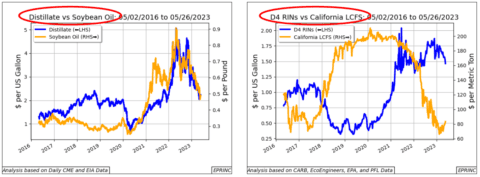
Calculating The Renewable Diesel Margin
The renewable diesel margin, a spread that gauges the implied returns of renewable diesel production, showed little volatility from 2016…
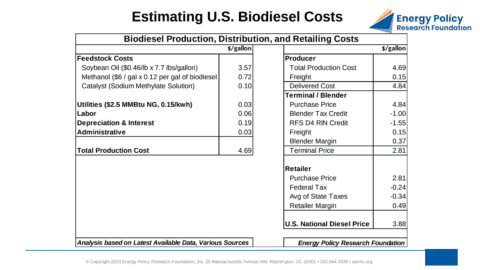
Estimating U.S. Biodiesel Costs
A typical gallon of commercially produced biodiesel costs nearly $4.70, well above the current national average retail diesel pump price…
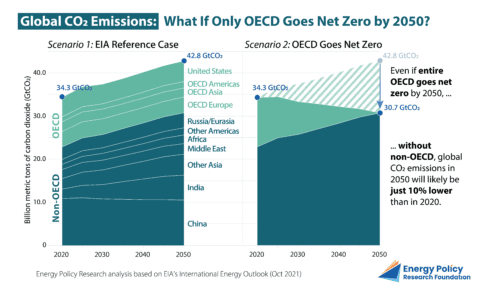
Global CO₂ Emissions: What If Only OECD Goes Net Zero by 2050? Batt Odgerel May 24, 2023 Washington, DC
Even if all OECD countries were to achieve net zero CO₂ emissions by 2050, global emissions would continue to be…
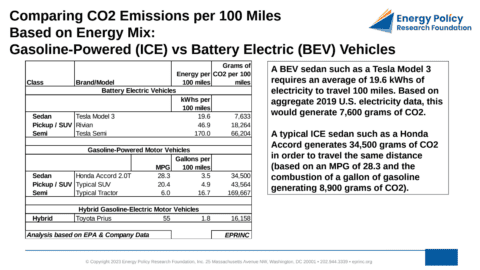
Comparing CO2 Emissions per 100 Miles Based on Energy Mix: Gasoline-Powered vs Battery Electric Vehicles
Based on the 2019 U.S. electricity mix, a battery-electric sedan generates roughly 7,600 grams of CO2 to travel 100 miles,…
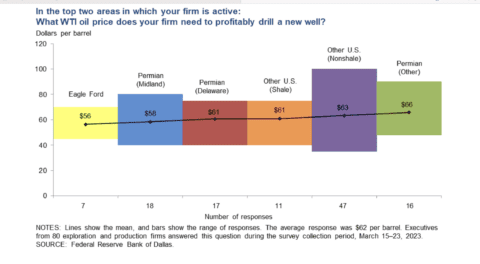
Dallas Fed Survey: U.S. Crude Oil Production Costs Are Rising
The Dallas Federal Reserve's first quarter 2023 survey shows U.S. crude oil producers' costs have risen since 2020, with the…
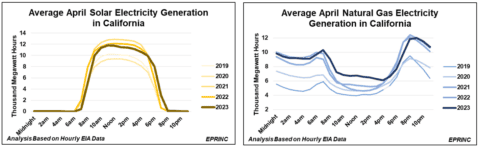
April in Sacramento: More Solar Generation in California Requires More Natural Gas Generation
As California's solar output grows, the state must call on natural gas generation to ramp up rapidly each afternoon as…
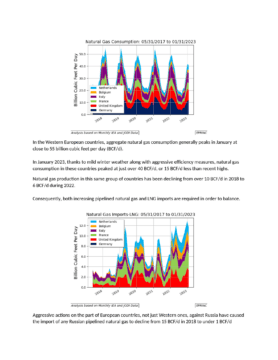
Western European Near-Term Natural Gas Requirements
Western European natural gas consumption typically peaks near 55 BCF/d in January, but mild winter weather and efficiency measures held…
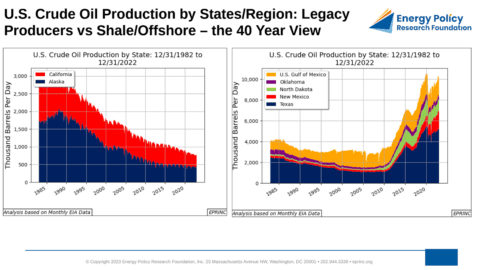
U.S. Crude Oil Production by States/Region: Legacy Producers vs Shale/Offshore – the 40 Year View
U.S. crude oil production over the past forty years has shifted markedly in both scale and geography, as legacy output…
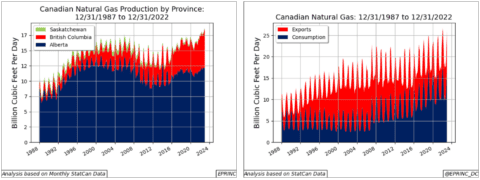
Canadian Provincial Oil & Natural Gas Production, Related Consumption and Exports
Canada is the world's fourth-largest crude oil producer and sixth-largest natural gas producer, with production concentrated in a few western…
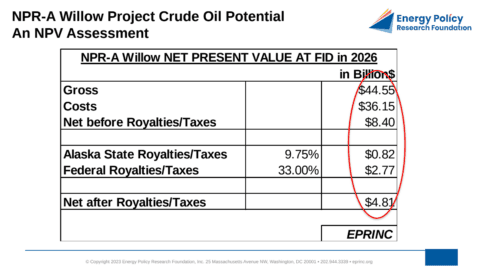
After Extensive Deliberation The National Petroleum Reserve-Alaska (NPR-A) Willow Project Is Set To Yield Revenue For Both The State And The Federal…
ConocoPhillips's Willow Project in the National Petroleum Reserve-Alaska carries an estimated net present value of $44.6 billion, with $2.8 billion…
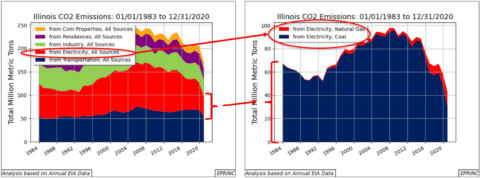
Illinois CO2 Emissions From Electricity Production
In 2019, Illinois' electricity generation emitted 58.2 million metric tons of CO2, equal to 1.1% of the U.S. total and…