
Chart of the Week
A new chart every week.

U.S. Rig Counts and Crude Oil Prices
U.S. crude oil rig counts in the primary producing basins have trended lower alongside a declining WTI benchmark since the…

The Renewable Fuel Standard: Costs to Refiners
As aggressive federal policy has tightened credit supplies, RIN prices have doubled since January 2025, and EPRINC estimates that compliance…

2025 U.S. Summer Gasoline Prices: Where’s the Spike?
U.S. gasoline prices typically climb with the onset of the summer driving season, but during the summer of 2025 they…

Heat Dome Regions (Northeast, Midwest and Texas) Power Generation (GW)
During the late-June 2025 heat dome, power generation across the ERCOT, MISO, ISNE, NYISO, and PJM regions peaked at 401,000…

Mideast Military Aggression, Hormuz Strait Tanker Traffic, and Crude Oil Prices
Following Iran's June 22, 2025 parliamentary authorization to block the Strait of Hormuz, tanker traffic through the waterway has begun…

A Mid-2025 Review: Natural Gas in Europe and Ukraine – Three Views
European natural gas imports have shifted decisively from pipeline gas to LNG, with the United States supplying the bulk of…
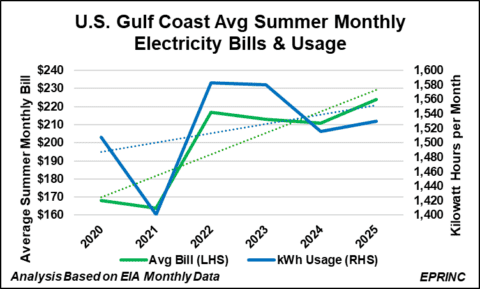
U.S. Summer Residential Electricity Trends: Three Views
U.S. summer residential electricity bills are rising even as household consumption edges lower, with the average monthly bill climbing from…
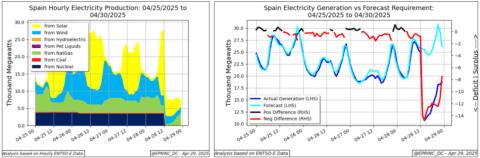
The April 2025 Iberian Peninsula Power Failure: An Overview with Considerations
On April 28, 2025, the Iberian Peninsula experienced a widespread power failure that cut electricity across Spain and Portugal. This…
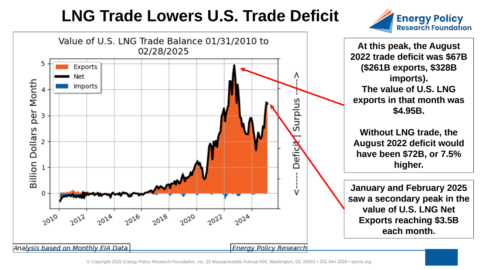
LNG (Liquefied Natural Gas) Trade Lowers U.S. Trade Deficit – Revisited
U.S. LNG exports, launched at scale in 2016, have grown into a persistent contributor to the nation's trade balance, with…
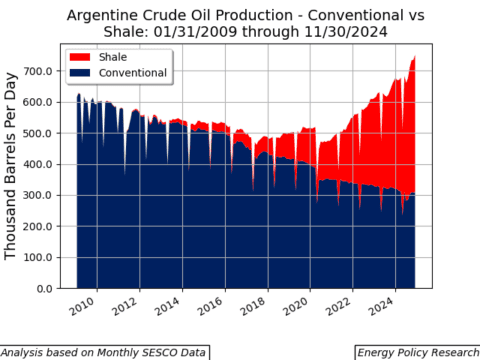
Shale Production has Revived Argentina’s Oil and Natural Gas Production
Development of the Vaca Muerta formation has reversed Argentina's declining conventional output, with shale now supplying nearly 60% of the…
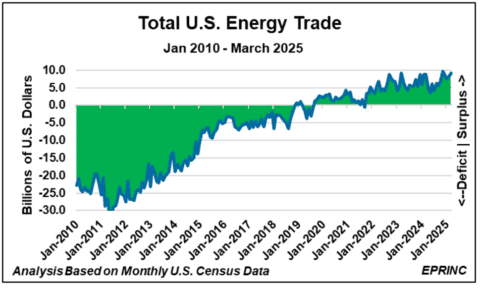
Energy Trade Positively Impacts the U.S. Trade Balance
The U.S. energy trade balance has swung from a monthly deficit exceeding $30 billion in 2012 to a current surplus…
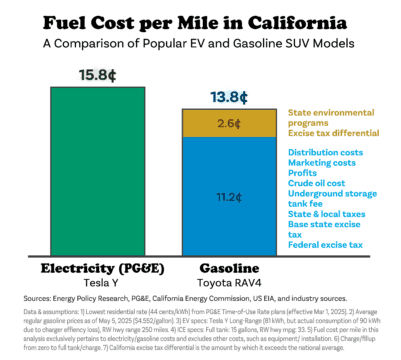
Fuel Cost per Mile in California
In California, the fuel cost per mile for electric vehicles remains lower than that of comparable gasoline-powered vehicles, though the…
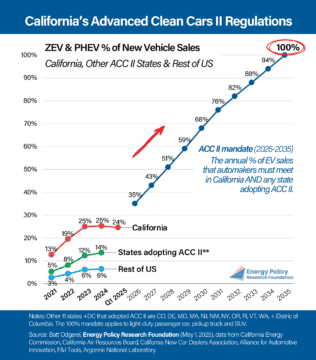
A Policy Destined to Fail? California’s EV Mandate
California's mandate requiring that a rising share of new vehicle sales be zero-emission vehicles faces significant implementation challenges, raising questions…
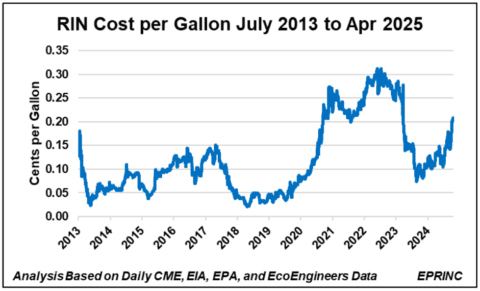
The Renewable Fuel Standard (RFS) and Transportation Fuel Prices – Revisited
Discretionary policy under the Renewable Fuel Standard—particularly the use of small refinery exemptions—drives the price of RINs, whose cost is…
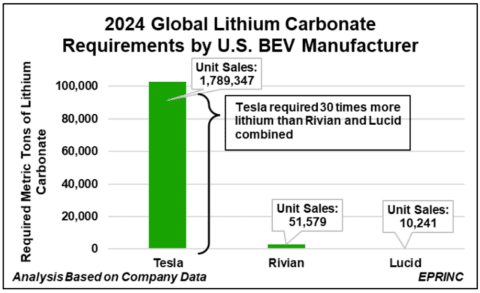
Global Lithium Requirements of Select U.S. BEV Manufacturers
Among the three U.S. BEV-only manufacturers, Tesla dominates lithium demand, requiring roughly 113,600 metric tons of lithium carbonate equivalent annually—about…
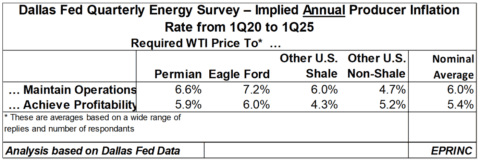
Dallas Fed Survey: U.S. Crude Oil Production Costs Are Rising – Revisited
The Dallas Fed's energy survey shows the average WTI price U.S. producers need to maintain operations has risen from just…
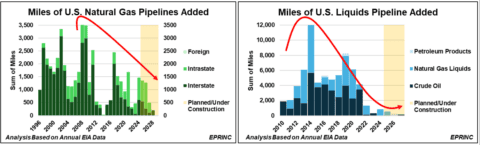
Abatements to Additional U.S. Pipeline Capacity Could Challenge Future Growth in U.S. Energy Production and Exports
New pipeline additions have slowed sharply since their late-2000s and mid-2010s peaks, and projections through 2030 show minimal planned capacity…
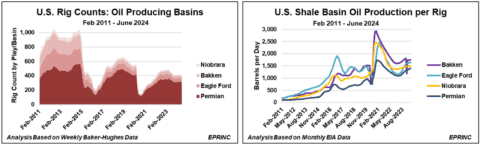
Measuring Productivity Improvements in U.S. Shale Oil and Gas Production
As fracking technology and data acquisition have advanced, the productivity of U.S. shale wells has risen dramatically—Appalachian natural gas wells…