
Chart of the Week
A new chart every week.
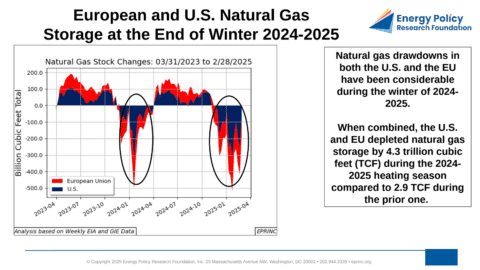
European and U.S. Natural Gas Storage at the End of Winter 2024-2025
A colder winter in 2024-2025, particularly during February, drove combined U.S. and EU natural gas storage drawdowns to 4.3 trillion…
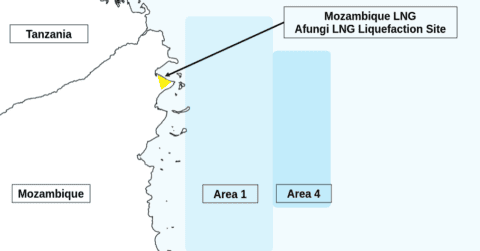
Mozambique LNG and the Role of The U.S. Export-Import Bank
The Mozambique LNG project, a $20 billion-plus onshore export facility, awaits its largest single source of financing—$4.7 billion from the…
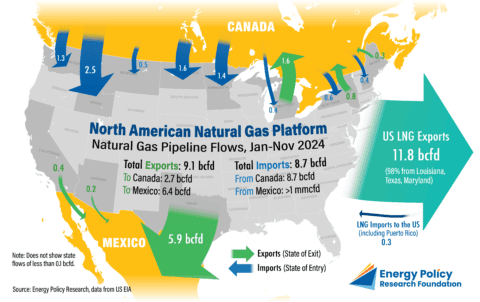
North American Natural Gas Platform: Natural Gas Pipeline Flows, Jan-Nov 2024
Natural gas pipeline flows across North America during the first eleven months of 2024 illustrate the continued integration of the…
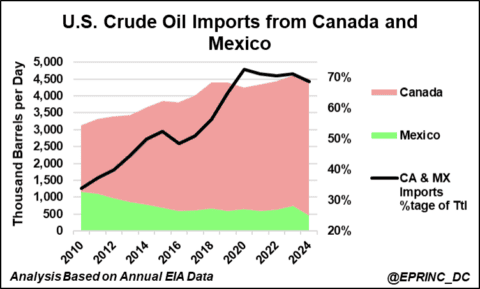
The Cost Impact of President Trump’s Tariffs on U.S. Crude Oil Imports from Canada and Mexico: A First Assessment
Applying the tariff rates set out in President Trump's February 1, 2025 Executive Orders, the added annual cost of U.S.…
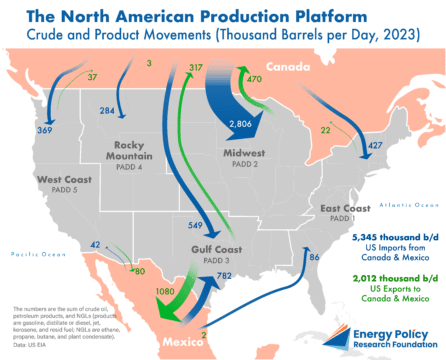
Crude Oil and Product Movements: The North American Production Platform
The chart maps the crude oil and refined product flows that integrate the U.S., Canadian, and Mexican energy markets, showing…
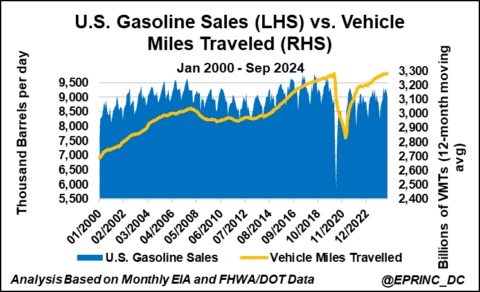
U.S. Gasoline Sales, Vehicle Miles Traveled, and Motor Vehicle Fuel Efficiency Revisited
U.S. gasoline consumption grew only 0.25% annually between 2000 and 2022, yet vehicle miles traveled rose nearly 1% per year…
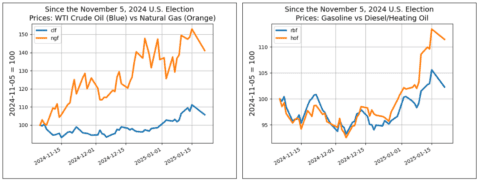
Impacts of the U.S. 2024 Presidential Election on Petroleum and Natural Gas Equities
Since the 2024 U.S. Presidential Election, crude oil and natural gas prices have diverged, with natural gas equities rising on…
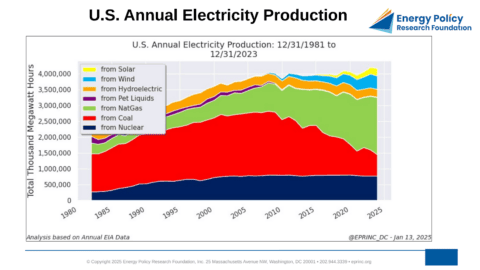
U.S. Electricity Production and Prices The Long View
Since 1981, U.S. electricity production has moved through two epochs: annual growth of 2.4% from 1981 to 2002, then a…