Skip to content
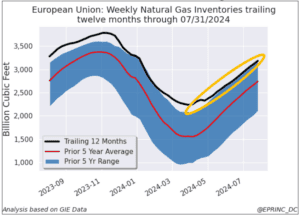 ChartThe Mid-2024 View: EU and Ukrainian Natural Gas StorageIn mid-2024, the EU was carrying natural gas inventories well above the trend of previous years, while Ukraine's inventories ran well below…
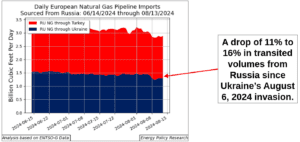 ChartRussian Pipelined Natural Gas to Europe: Is Ukraine’s Invasion a Threat?Ukraine's early-August 2024 incursion into Russia's Kursk Oblast, including the seizure of Gazprom's Sudzha compressor station, coincided with a measurable drop in…
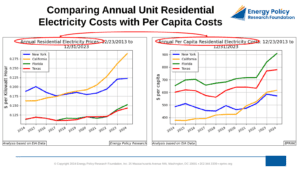 ChartNew York, California, Florida, Texas: Comparing Annual Unit Residential Electricity Costs with Per Capita CostsAmong the four most populous U.S. states, California has the highest residential electricity unit cost at 28.9 cents per kWh in 2023,…
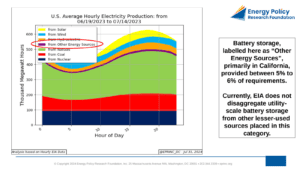 ChartU.S. Mid-Summer Heat Wave Met by Record Natural Gas Power GenerationDuring the June 19–July 14, 2024 national heat wave, natural gas supplied between 38% and 52% of U.S. power requirements, and a…
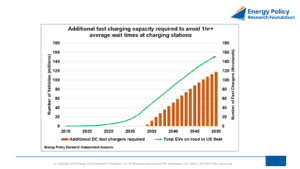 ChartErrata: Additional DC Fast Charging Capacity Required Acceptability of EV Wait TimesAn erratum revising two earlier charts finds that fewer DC fast chargers will be needed by 2050 than initially projected, but at…
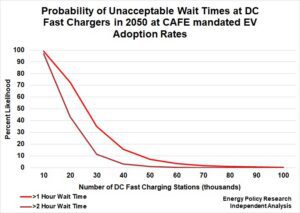 ChartAcceptability of EV Wait Times at DC Fast Charging LocationsEven in scenarios where average EV wait times at DC fast charging stations are held under an hour, infrequent high-impact events would…
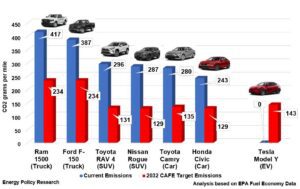 ChartEmissions of Current Popular Vehicles and Required 2032 Compliance LevelsIn March 2024, the EPA raised Corporate Average Fuel Economy (CAFE) standards to require light-duty vehicle emissions to fall to half of…
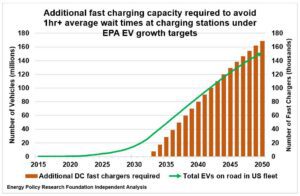 ChartPotential for Charging Station Deficiency Under EPA’s Electric Vehicle (EV) Expansion ProgramWhile the current U.S. network of fast charging stations is adequate for today's small EV fleet, EPRINC's analysis finds that under the…
 ChartA Tale of Two States on Electricity PricesCalifornia and Texas illustrate divergent outcomes on electricity prices, with the two states following markedly different trajectories.
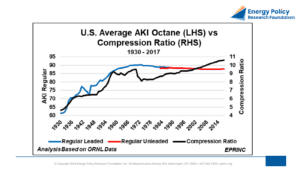 ChartOctane vs Compression RatioFrom the 1930s through the mid-1970s, average engine compression ratios of gasoline-powered vehicles climbed from about 4-to-1 to roughly 10.5-to-1, with gasoline…