Skip to content
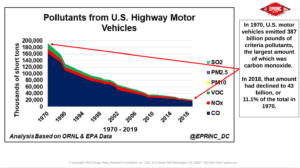 ChartU.S. Motor Vehicle Pollution Reduction Progress since 1970Criteria pollutant emissions from new automobiles have fallen dramatically since 1970. A 1968 Ford Mustang emitted between roughly 1,500 pounds and one…
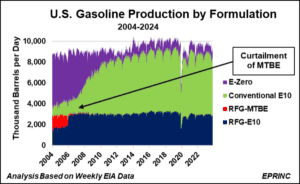 ChartChanges in Gasoline Formulations in Response to More Exacting Pollution Standards and Blending MandatesThe chart traces the evolution of U.S. gasoline formulations over the past twenty years, showing how successively more exacting pollution standards and…
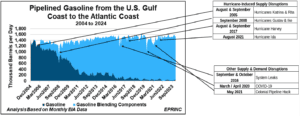 ChartDisruptions of Pipelined Gasoline from the U.S. Gulf Coast to the Atlantic CoastAs the DOE prepares to sell down the one-million-barrel Northeast Gasoline Supply Reserve between May 27 and June 30, 2024, NOAA's forecast…
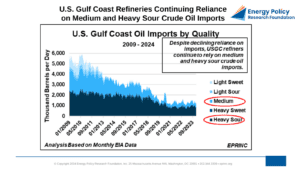 ChartU.S. Gulf Coast Refineries Continuing Reliance on Medium and Heavy Sour Crude Oil ImportsRefineries along the U.S. Gulf Coast, which account for 55% of U.S. refining capacity and are optimized for medium and heavy sour…
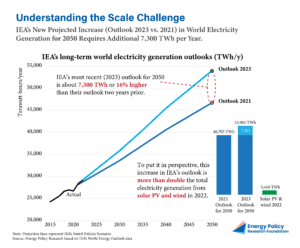 ChartUnderstanding the Scale ChallengeThe IEA's electricity generation outlooks for 2050 illustrate the scale of expansion required across generation sources, underscoring the magnitude of the challenge…
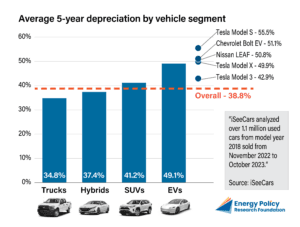 ChartVehicle DepreciationVehicle depreciation rates vary significantly across powertrain types, with implications for total cost of ownership and consumer purchasing decisions.
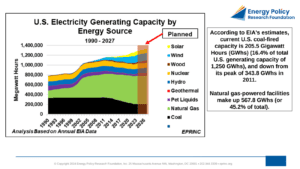 ChartEPA’s Power Plant Rule, Declining U.S. Electricity Generating Capacity, and Growing Power Demand Have Capacity Requirements Been Underestimated in the Face…EPA's newly finalized power plant rule would retire a substantial share of dispatchable coal and natural gas capacity even as demand pressures…
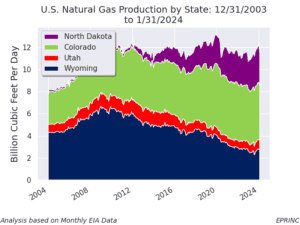 ChartU.S. Natural Gas Production by Producing Region and State, and the Contribution of Oil & Gas Extraction to these States’ GDPDuring 2023, three U.S. regions comprising 11 states produced an average of 107 BCF/d, or 95% of total U.S. marketed natural gas…
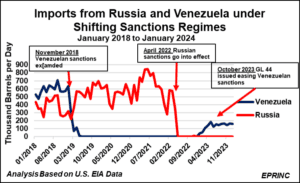 ChartU.S. Crude Oil & Product Imports from Russia and Venezuela under Shifting Sanctions RegimesBroader sanctions context: how U.S. import patterns shift under geopolitical pressure.
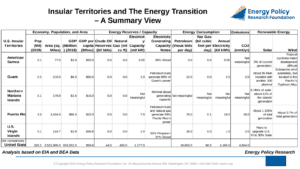 ChartU.S. Insular Territories and The Energy Transition: A Summary ViewA summary table of the five primary U.S. insular territories shows economies built largely on military bases and tourism, an electricity system…