
Chart of the Week
A new chart every week.
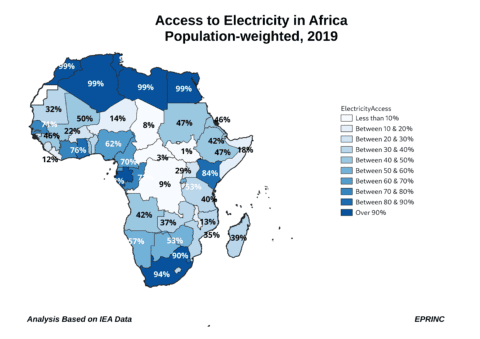
Access to Electricity in Africa
Access to electricity across Africa remains uneven, with substantial disparities in electrification rates among countries on the continent.
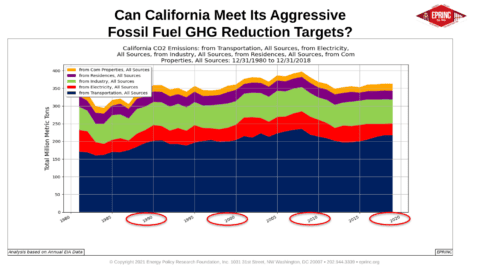
Can California Meet Its Aggressive Fossil Fuel GHG Reduction Targets?
California has established aggressive targets for reducing greenhouse gas emissions from fossil fuels, raising questions about whether the state can…
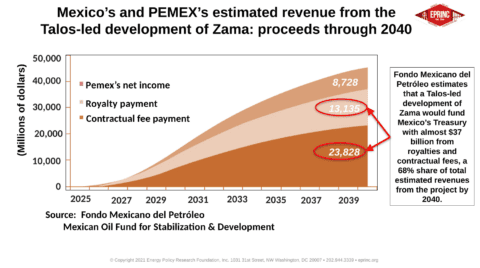
Talos-led estimated revenue from the development of Mexico’s Zama field: Proceeds through 2040
Drawing on estimates from Mexico's Fondo Mexicano del Petróleo, the chart shows that a Talos-led development of the Zama field…
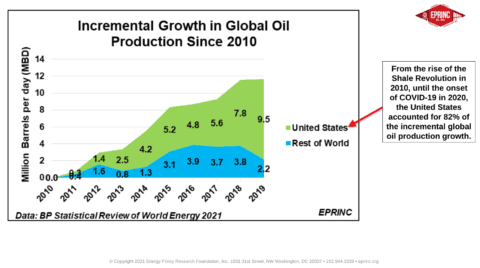
Incremental Growth in Global Oil Production Since 2010
From the rise of the Shale Revolution in 2010 until the onset of COVID-19 in 2020, the United States accounted…
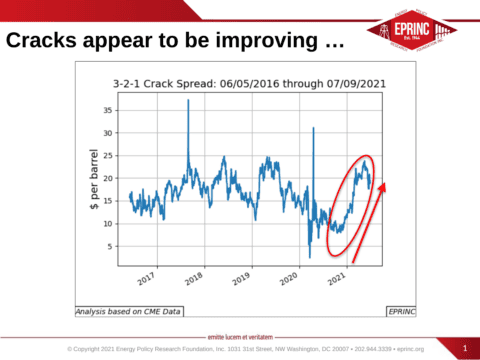
Cracks appear to be improving …
Refining crack spreads appear to be recovering, suggesting improving margins across the sector.
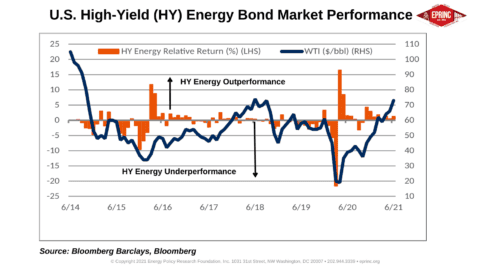
U.S. Energy Debt Market: A Look at High-Yields
The U.S. high-yield energy bond market has moved through distinct periods of outperformance and underperformance relative to the broader high-yield…
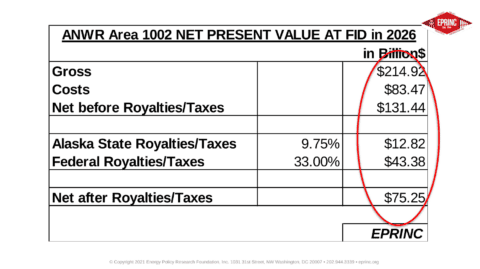
The Arctic National Wildlife Refuge Crude Oil Potential: An NPV Assessment
This assessment examines the crude oil potential of the Arctic National Wildlife Refuge through a net present value (NPV) framework.
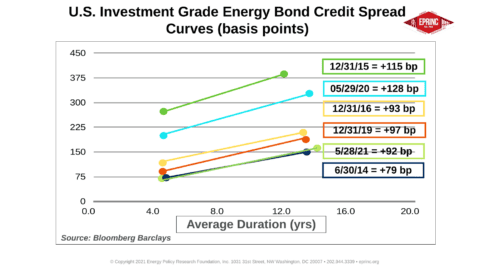
U.S. Energy Debt Market Snapshot
U.S. investment grade energy bond credit spreads have narrowed to +92 basis points as of May 28, 2021, down from…
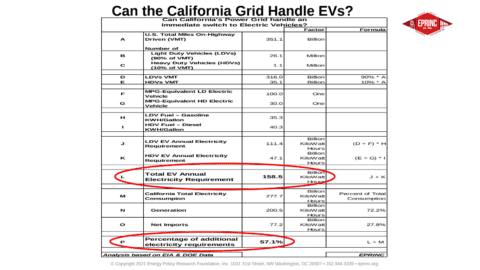
Can the California Electricity Grid Immediately Switch to an All EV Fleet?
California's current electricity grid capacity would be insufficient to immediately support a full transition to an all-electric vehicle fleet without…
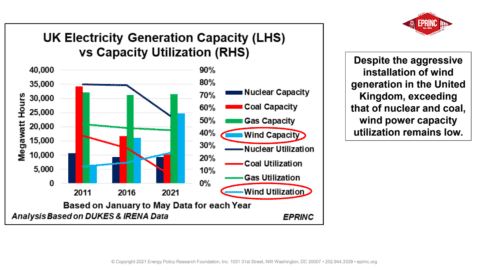
UK Electricity Capacity vs Electricity Generation Be Wary of the Headwinds
Despite the United Kingdom installing wind generation capacity that exceeds that of nuclear and coal, wind power capacity utilization remains…
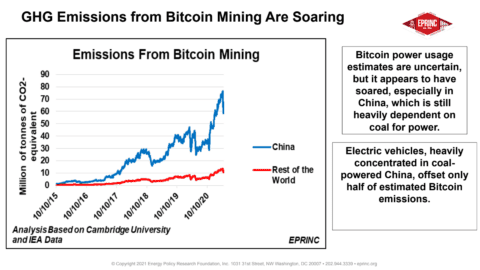
Bitcoin Emissions Offset EV GHG Savings
A comparison of estimated greenhouse gas emissions from global bitcoin mining against the GHG savings from electric vehicles suggests that…
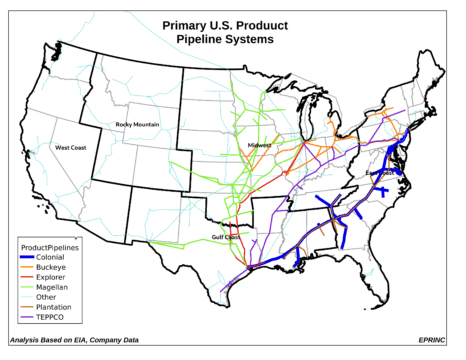
U.S. Atlantic Coast is dependent on Gulf Coast and MidContinent Petroleum Product Supplies
The U.S. Atlantic Coast, spanning Georgia to Maine, relies on petroleum product supplies delivered from the Gulf Coast and MidContinent…
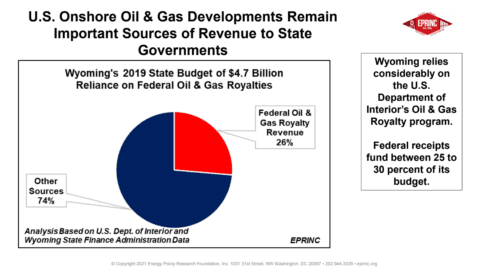
Competition in U.S. Oil & Gas Upstream Development Yields Substantial Revenue to State Governments – the case of Wyoming
Wyoming relies considerably on the U.S. Department of the Interior's Oil & Gas Royalty program, with federal receipts funding between…
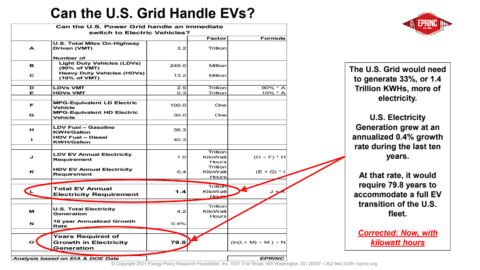
Can the U.S. Electricity Grid Immediately Switch to an All EV Fleet?
A complete transition of the U.S. vehicle fleet to electric power would require the grid to generate an additional 1.4…
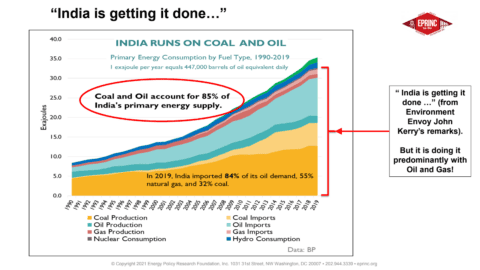
“ India is getting it done …” (from Environment Envoy John Kerry’s remarks). But it is doing it predominantly with Oil and Gas!
While India's energy progress has been acknowledged by policymakers, the country's growth continues to be met predominantly through oil and…
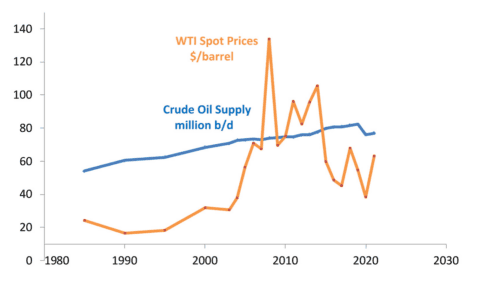
With Global Oil Demand on the Rebound, What About Supply?
About EPRINC The Energy Policy Research Foundation, Inc. (EPRINC) was founded in 1944 and is a not-for-profit, non-partisan organization that…
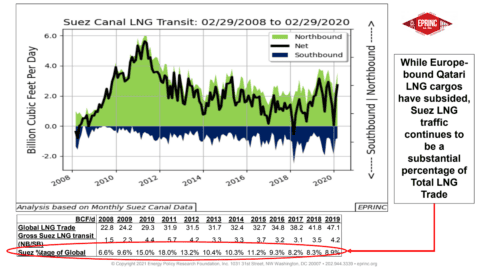
LNG Suez Canal Traffic in Perspective
While Europe-bound Qatari LNG cargoes have subsided, LNG traffic through the Suez Canal continues to represent a substantial percentage of…
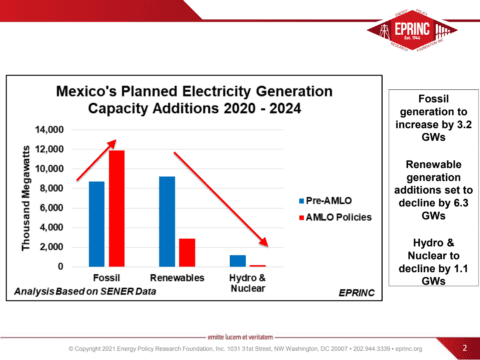
Changes to Mexico’s Planned Electricity Capacity Additions pre/post AMLO
Under the AMLO administration, Mexico's revised electricity capacity plans call for an increase of 3.2 GW in fossil generation, while…