
Chart of the Week
A new chart every week.
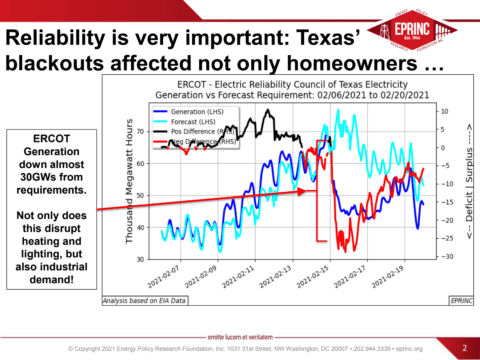
Chart 3
Charts of the Week: ERCOT: Two Weeks in February “Freezin’ Down in Texas, All the Refineries are Down”
During the mid-February 2021 cold event, ERCOT generation fell nearly 30 GW below system requirements, disrupting not only residential heating…
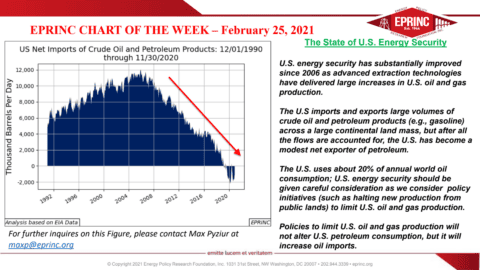
Chart 1
Net U.S. Petroleum Imports, 1990 to 2020
Net U.S. petroleum imports have declined substantially since 2006, driven by increases in domestic oil and gas production from advanced…