Skip to content
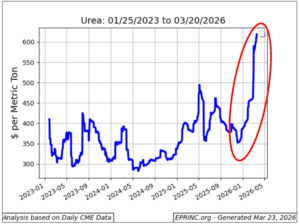 ChartStrait of Hormuz Closure: Nitrogen Based Fertilizers and Disruptions to Food SecurityEarlier chart on the fertilizer supply shock. Roughly one-third of global seaborne fertilizer trade transits Hormuz, and urea prices have surged over 50% since hostilities began, threatening Northern Hemisphere planting.
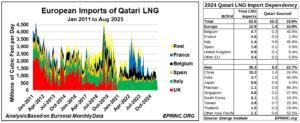 ChartStrait of Hormuz Closure: Qatari LNG Curtailment and the Global Gas MarketEarlier chart on the halt of Qatari LNG exports, with nearly 20% of global LNG supply curtailed as force majeure declarations cascade through Qatar's customer base.
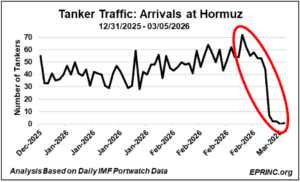 ChartStrait of Hormuz Closure: Tanker Traffic, Benchmark Prices, and InventoryBenchmark price panel showing Brent crude surge past $100/bbl.
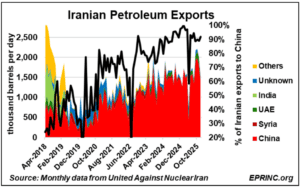 ChartIranian Petroleum Exports Under Shifting U.S. Sanctions RegimesUpdated sanctions impact analysis published one week before the crisis.
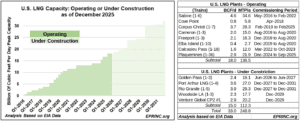 ChartU.S. LNG Export Capacity: Operating and Under ConstructionU.S. export capacity context as global LNG markets scramble for alternatives.
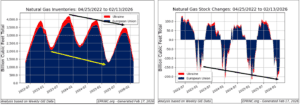 ChartEuropean Natural Gas Inventories A Late 2025-2026 Winter AssessmentEuropean gas storage levels heading into the disruption, critical given the 20% drop in global LNG supply.
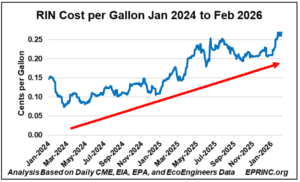 ChartThe Renewable Fuel Standard: Cost to Consumers – RevisitedEPRINC estimates the Renewable Fuel Standard currently adds about 27 cents per gallon of transportation fuel, translating to nearly $53 billion in…
 ChartPower Generation During Winter Storm Fern – The View From New EnglandDuring Winter Storm Fern, diesel-fired generation supplied an average of 31.3% of New England's electricity—peaking at 43.5%—despite costing roughly 4.6 times as…
 ChartPower Generation During Winter Storm FernDuring Winter Storm Fern (January 22–26, 2026), dispatchable sources supplied 85% of average load and 90% at the 298 GW peak across…
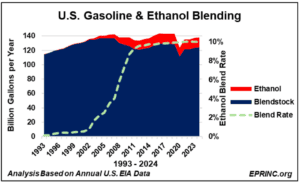 ChartThe Renewable Fuel Standard (RFS) Ethanol Blend RatesAlthough EPA mandated a 12.5% ethanol blend rate in 2024, U.S. gasoline marketers in the aggregate blended at only 10%, a persistent…