
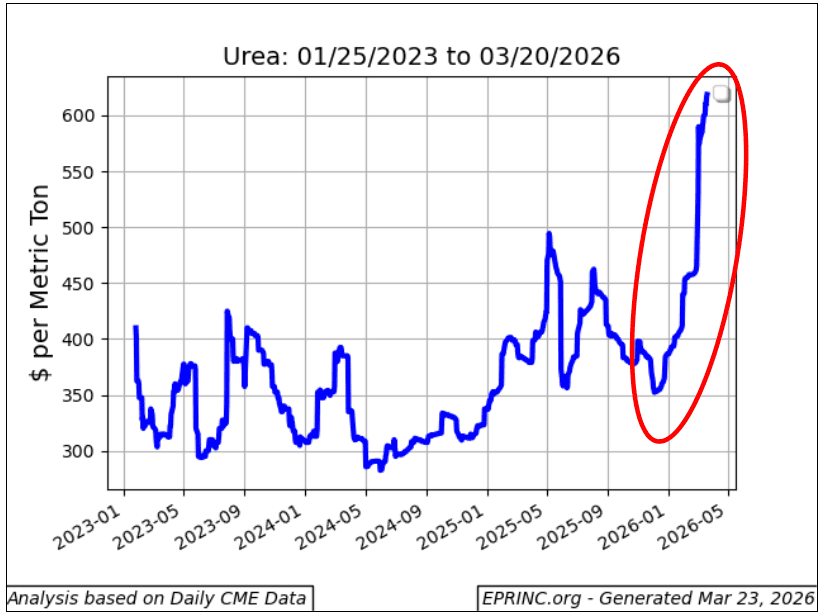
Global attention on the Israel/U.S.-Iran War, now in its fourth week, has centered on crude oil and LNG flows through the Strait of Hormuz. A second commodity shock has received far less notice: the disruption of Gulf fertilizer exports. Unlike oil, fertilizer cannot be drawn from a strategic reserve, and the agricultural consequences of a prolonged closure could ultimately affect more lives than the energy consequences.
Nitrogen-based fertilizers rest on a single industrial process. The Haber-Bosch synthesis of ammonia combines atmospheric nitrogen with hydrogen derived from methane. Research by Erisman et al. (Nature Geoscience, 2008) found that roughly half of the nitrogen atoms in the human body have passed through this process, and Vaclav Smil has estimated that without synthetic ammonia it would be impossible to feed 40% to 50% of the world’s population — nearly 4 billion people.
The Persian Gulf has become one of the most concentrated nodes of nitrogen fertilizer production. The eight countries ringing the Gulf — Bahrain, Iran, Iraq, Kuwait, Oman, Qatar, Saudi Arabia, and the UAE — produced approximately 10.5 million metric tons (MMT) of ammonia-based fertilizers in 2023, about 8.7% of global production, up from 3.8 MMT and 4.3% of global supply in 1998. This growth reflects deliberate investment in export-oriented gas-to-fertilizer infrastructure built on the region’s abundant, low-cost natural gas feedstock. All of this production is now at a standstill, with no alternative export routes available.
Urea is the most widely traded nitrogen fertilizer, accounting for more than half of global nitrogen fertilizer trade by volume, and its standardized, globally traded price serves as the benchmark for the broader nitrogen complex. Since the onset of the conflict, benchmark urea prices have surged from about $350/MT to over $600/MT — a rise of more than 70% in under four weeks — approaching the 2022 post-Ukraine-invasion spike. According to The Fertilizer Institute, the Gulf accounts for 43% of global urea trade and 25% of trade in other nitrogen-based fertilizers.
EPRINC’s analysis of 2022 UN Comtrade and WITS bilateral trade data measures exposure as a share of national urea consumption. Mozambique sources 82.4% of its urea from Gulf producers (almost entirely Iran) and South Africa 80.6%; Turkey, at 62.4%, is the most exposed major European economy. Thailand (50.9%) and Australia (50.6%) each source more than half their urea from the Gulf, with Bangladesh at 36.2% and New Zealand at 35.1%. Sub-Saharan Africa shows a regional dependence near 48%. The United States produces roughly 94% of its nitrogen fertilizer domestically but imports about 27.2% of its urea — some 2.67 MMT at 2022 volumes — from Gulf suppliers, primarily Qatar and Saudi Arabia, with demand concentrated in the spring planting window when domestic inventories are lowest.
Fertilizer is not a substitutable commodity on short timelines. Farm input decisions are made weeks in advance, and a sustained closure would reduce physical availability within a single planting cycle of three to six months. The rational farm-level response to input costs rising faster than output prices is to apply less — a decision that, multiplied across millions of smallholder plots, means lower yields and diminished caloric output in the regions least equipped to absorb the shock.
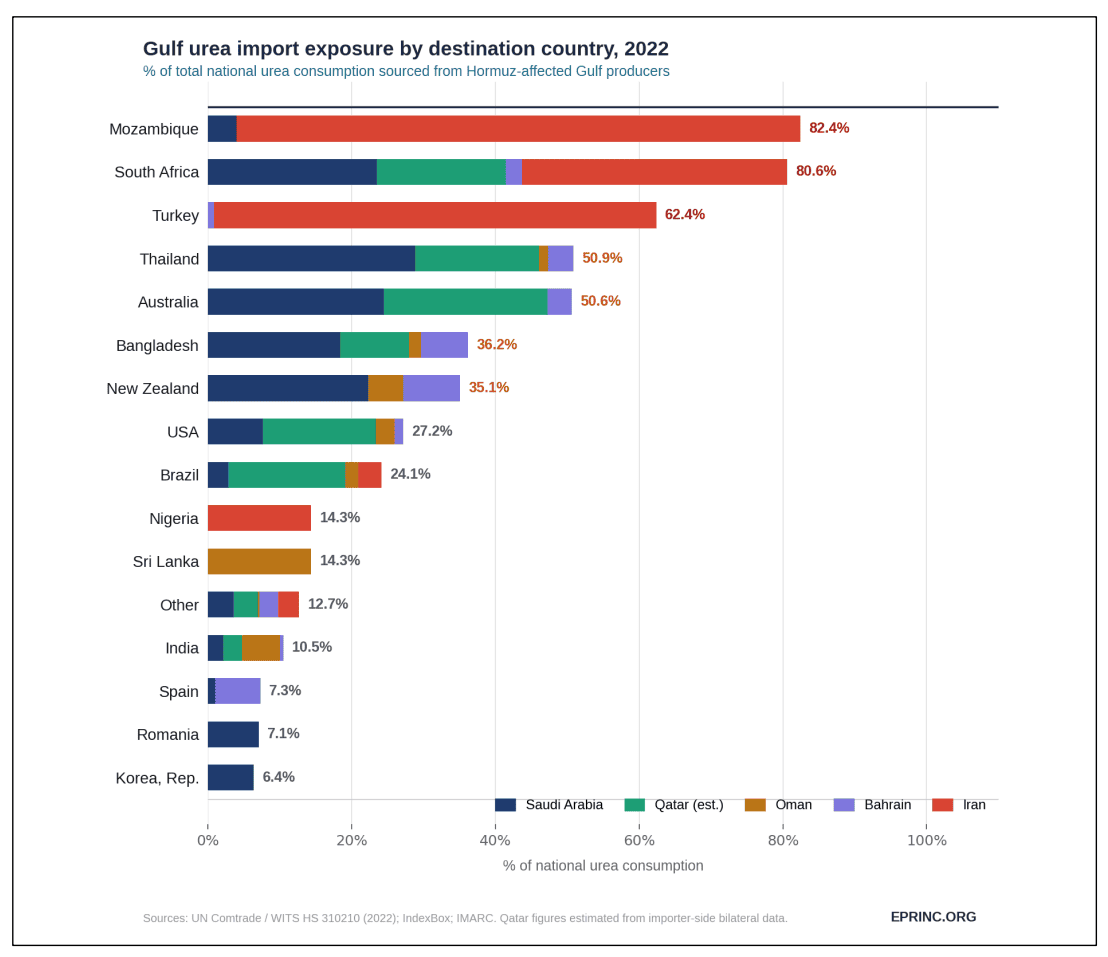
As a result of the Strait of Hormuz crisis, several countries are at risk of a greater than 33% disruption to their urea supply. Particularly exposed are African and southeast Asian countries, which have more difficulty rebalancing or finding other nitrogen-based fertilizers.
Relevant and not displayed in this chart is the population density and per capita GDP of these countries. Higher density and less wealthy countries are more likely to experience famine and mass migration as a result of high food prices.
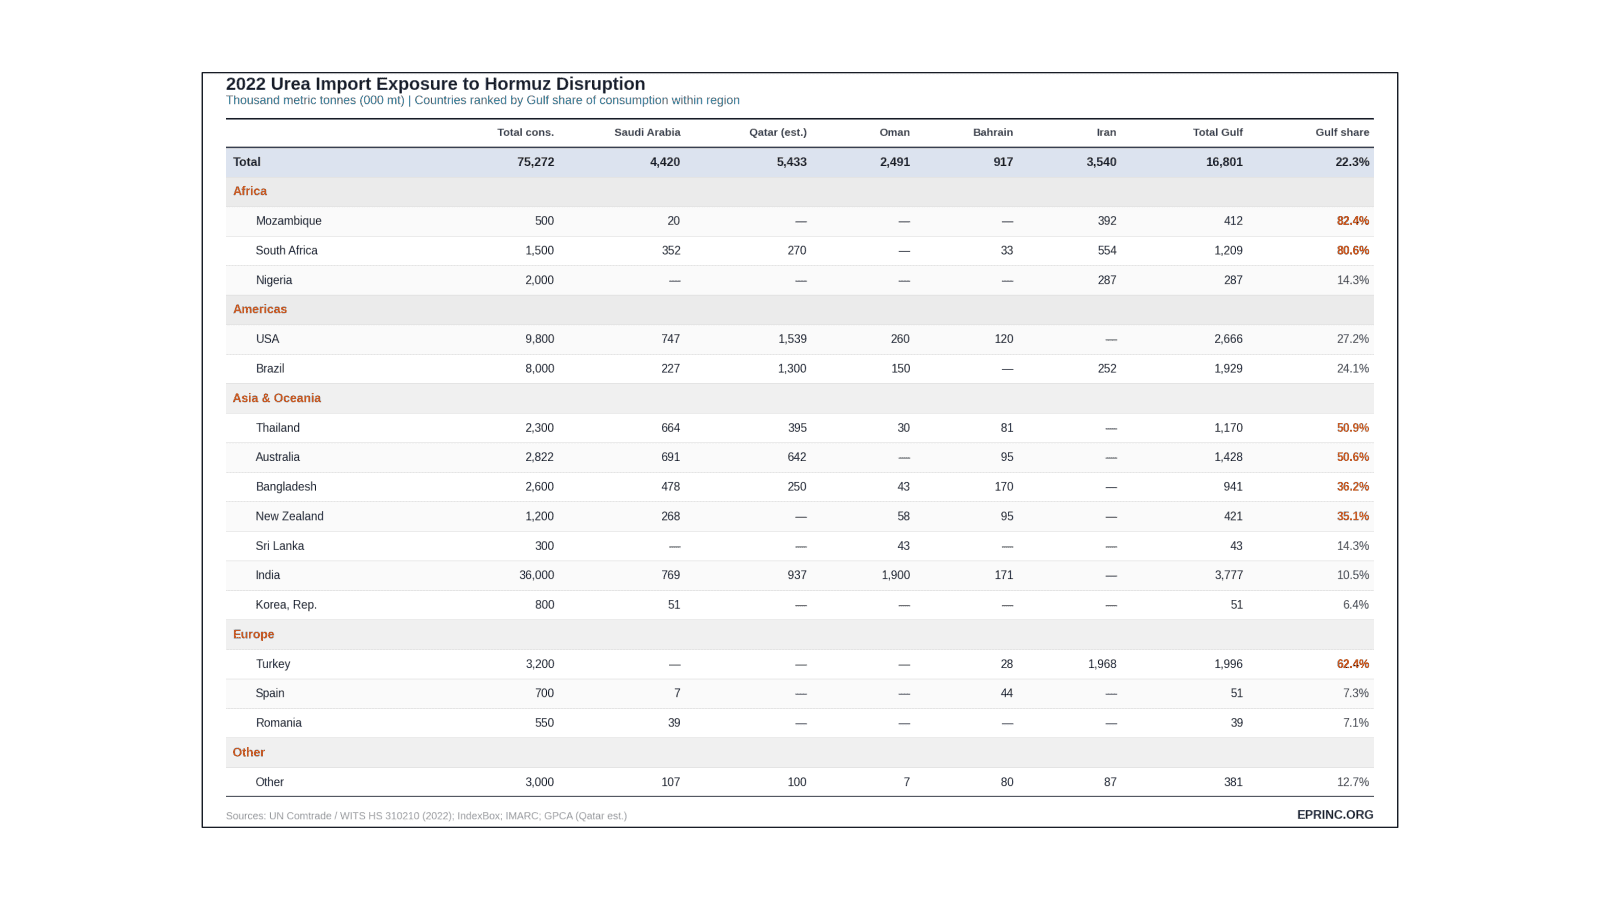
From the EPRINC Chart of the Week archive.
Cite: EPRINC, “Strait of Hormuz Closure: Nitrogen Based Fertilizers and Disruptions to Food Security,” Chart of the Week 2026-12, March 16, 2026.