Skip to content
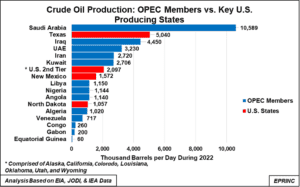 ChartCrude Oil Production: OPEC Members vs. Key U.S. Producing StatesU.S. crude oil production has surged to 11.9 million barrels per day in 2022 from 5 million in 2008, and when ranked…
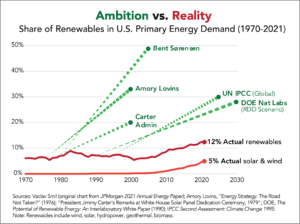 ChartRenewable Share In USPrimary Energy DemandDespite decades of ambitious scenarios and government targets for renewable energy in the United States, renewables continue to account for a modest…
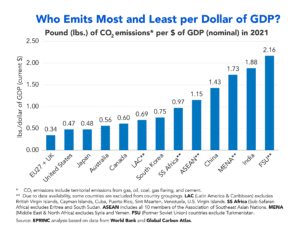 ChartCO2 Per Dollar Of GDPDespite mounting pressure to cut emissions quickly, the United States and its OECD peers remain among the least emission-intensive economies in the…
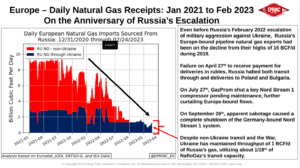 ChartOn the Anniversary of Russia’s EscalationOne year after Russia's escalation of its war against Ukraine, LNG became Europe's primary source of natural gas over the course of…
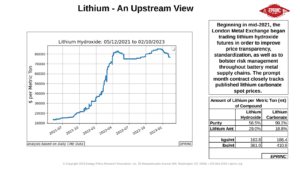 ChartLithium – An Upstream ViewLithium prices have risen sharply as demand for battery metals outpaces supply, tripling the lithium cost embedded in a single Tesla Model…
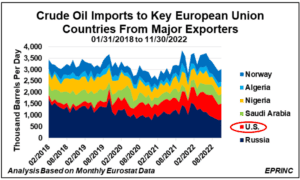 ChartEU Crude Oil Trade: Shifts due to Russia’s WarEU crude oil imports have held relatively steady over the past five years, but Russia's war has reshaped their sources: key EU…
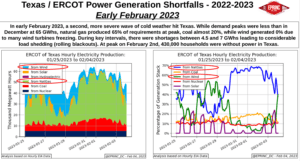 ChartERCOT: Freezin’ Down in Texas – Mid-Winter 2022-2023 Generation Mix, Shortfalls, and Refinery UtilizationDuring the winter of 2022-2023, two waves of extreme cold forced Texas' ERCOT grid into repeated generation shortfalls, with natural gas supplying…
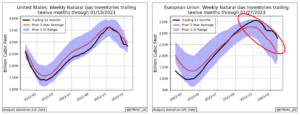 ChartNatural Gas Storage Mid-Winter 2022-2023 in the Northern LatitudesCoordinated emergency measures by European leaders, combined with mild winter weather, have muted natural gas demand and contributed to ample storage. Storage…
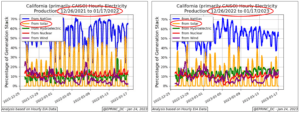 ChartCalifornia Solar Generation During the 2022-2023 Pineapple ExpressDuring the 2022-2023 "Pineapple Express," heavy rain and cloud cover cut California's midday solar output to an average of 6.9 thousand megawatt…
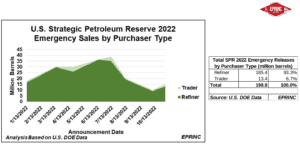 ChartU.S. SPR 2022 Emergency Sales by Purchaser TypeOf the roughly 200 million barrels sold under the 2022 emergency SPR drawdown, refiners took 93.3% and trading organizations 6.7%; the U.S.…