
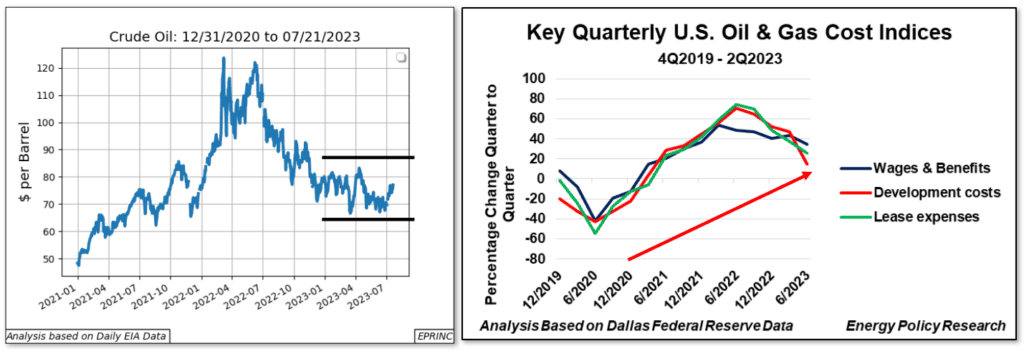
The chart examines conditions in U.S. crude oil markets, pairing price and cost trends with rig counts and production growth to identify emerging headwinds.
Prices have flattened and become range-bound even as costs rise. Squeezed by these dynamics, rig counts are declining and the growth in domestic production is beginning to flatten.
These indicators point to a slowing in the pace of U.S. crude oil output expansion, a shift with implications for supply outlooks and market balances.


From the EPRINC Chart of the Week archive.