
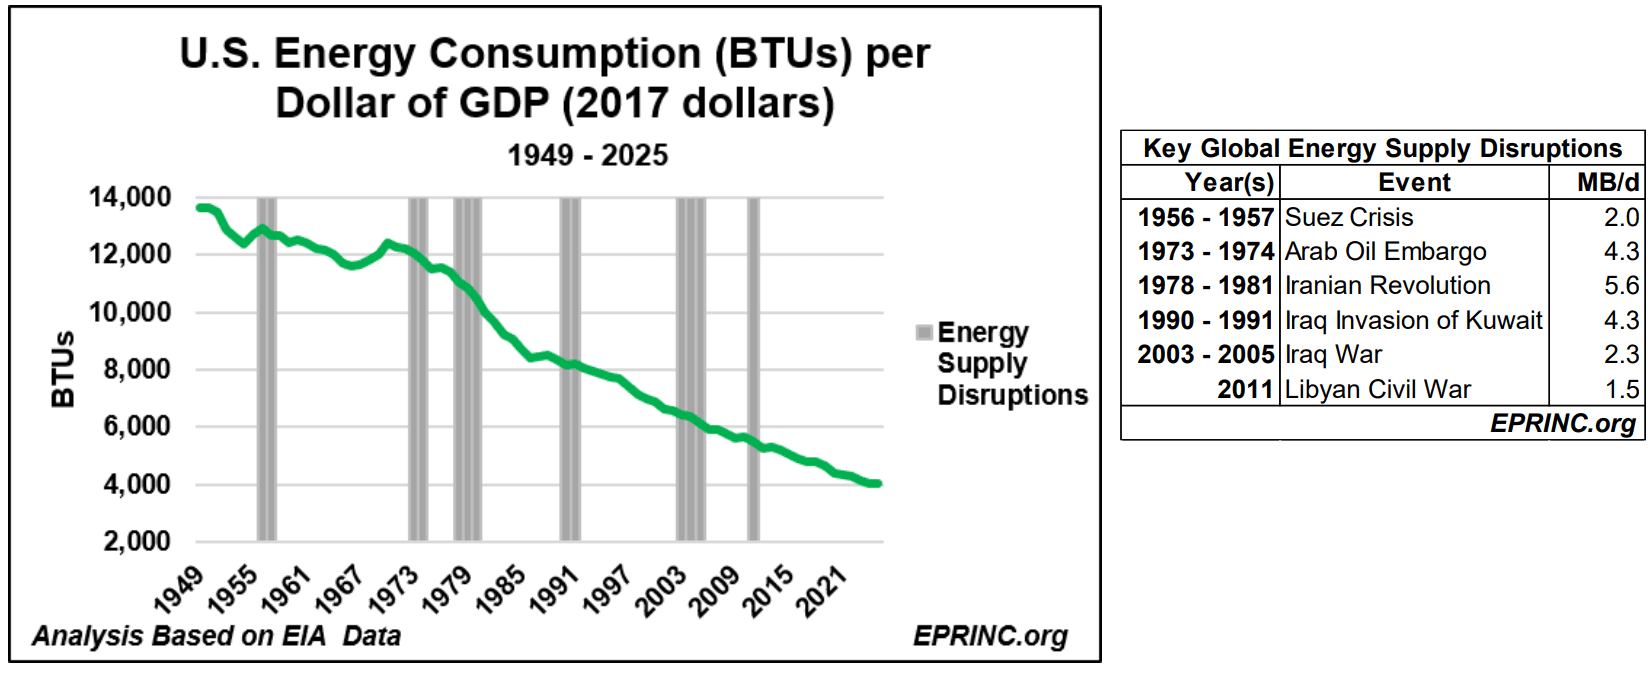
From 1949 to 2025, U.S. energy efficiency improved at an annualized rate of 1.6%, such that each dollar of inflation-adjusted GDP in 2025 required only 30% of the energy it did in 1949, even as the economy grew to 9.5 times its 1949 size.
Energy security is a reoccurring topic especially during periods of rising prices and imminent scarcity such as the current one with the closure of the Hormuz Strait due to the U.S./Israel – Iran War. Therefore, it is important to assess long-term improvements in energy security in the context of previous key global supply disruptions.
Energy security is described in three dimensions: availability, affordability, and acceptability. Acceptability is further broken down into efficiency and environmental impact. One way of measuring efficiency is to divide the total amount of energy that has been consumed by total inflation-adjusted GDP.
Using annual primary energy consumption data as compiled by EIA (U.S. Energy Information Administration) and chained to 2017 U.S. GDP time-series compiled by BEA (U.S. Bureau of Economic Analysis), U.S. energy efficiency improved at an annualized rate of 1.6% as U.S. inflation-adjusted GDP has risen over 3% in the period from 1949 to 2025. Expressed differently, U.S. GDP in 2025 required 30% of the energy per dollar of output than it did in 1949 while having grown to a size 9.5 times greater.
While there is no question that current petroleum product price spikes that have been brought on by the War are challenging, and even hardship-inducing in certain cases, the situation would be considerably more severe in a less energy-efficient regime.
For more information on this chart, please contact Max Pyziur (maxp@eprinc.org).
From the EPRINC Chart of the Week archive.
Cite: EPRINC, “U.S. Energy Intensity 1949-2025,” Chart of the Week 2026-19, May 20, 2026.