
The pipeline would permit the shipment of increased volumes of heavy crudes to U.S. Gulf Coast refiners from expanded oil sands production sourced from the vast reserves located in the Western Canada Sedimentary Basin in Alberta. Under U.S. law, all cross border oil pipelines entering the United States require final approval from the U.S. Department of State. The State Dept. has delayed a decision on the expansion project to allow more time to assess whether the project is in the interest of the United States. The decision on whether or not to issue a permit for the proposed pipeline is expected to be made in early 2011.
The pipeline extension would permit the shipment of an additional 509,000 b/d (barrels per day) of Canadian oil to Gulf Coast refiners. Most of the expanded import volume would be in the form of blended bitumen which is similar to heavy crude oil. Because of production declines in Mexico and Venezuela, U.S. refiners are receiving reduced shipments of heavy crudes. Higher volumes of heavy crudes from Canada offer considerable potential to improve operating margins for U.S. refiners, many of whom long ago made expensive upgrades in complex facilities that favor heavy oil. Additionally, TransCanada is looking to expand the Keystone XL capability by offering Bakken oil producers, located in North Dakota and Montana, a chance to link into the pipeline and send their crude to Gulf Coast refineries for the first time. By increasing transport efficiency and allowing Bakken producers to tap into new refinery markets, the Keystone XL project will have the added benefit of improving wellhead values for oil production from the Bakken formation.
Economic benefits from the project are therefore in two categories: (i) greater efficiency in the production of transportation fuels by matching heavier crudes to the abundant and complex technology prevalent in the U.S. refining fleet, particularly in the Gulf Coast region, and (ii) greater efficiency in the delivery of crude oil into and within the U.S. market. The project also provides improvement in security of supply of crude oil for the U.S. market since construction of the pipeline will also include a long-term commitment for delivery of supplies accompanied by a high degree of confidence that commercial and trade relations will be sustained.
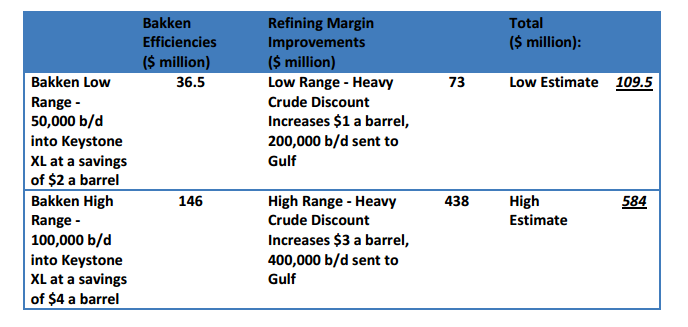
EPRINC estimates that the Keystone expansion would provide net economic benefits from improved efficiencies in both the transportation and processing of crude oil of $100-600 million annually, in addition to an immediate boost in construction employment.
Background
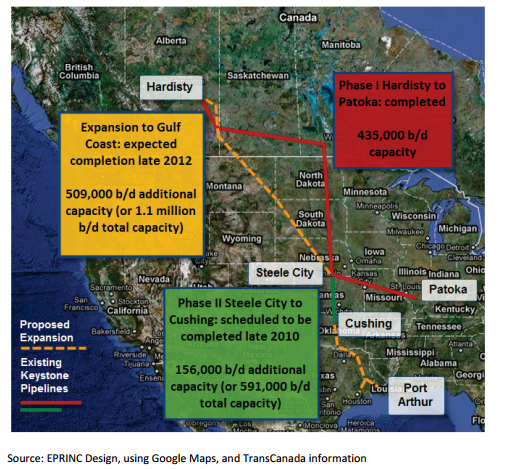
Phase I of the $12 billion Keystone project was completed in early 2010 and is operating with a capacity of 435,000 b/d, sending crude from Alberta to Illinois (shown in red in figure 1 below). Phase II has yet to be completed, but it will connect Steel City to Cushing, OK and bring capacity up to 591,000 b/d (shown in green in figure 1 below). The proposed expansion of the Keystone pipeline would extend from Alberta through Cushing, Oklahoma and down to the Gulf refineries, adding an additional 509,000 b/d of capacity for a total of 1.1 million b/d from the entire Keystone pipeline. Construction on the Canadian leg of the Gulf Coast expansion has begun; however, work on the U.S. segment of the pipeline has not commenced as the U.S. Department of State has postponed a final determination to address a range of economic, engineering, and environmental issues. Among these are concerns over the integrity of the engineering design, the procedures for issuing eminent domain permits, and the tariff structure.
Figure 1. TransCanada’s Keystone Expansion Pipeline
Resolving differences over tariffs and engineering issues are likely to be worked out through long established procedures for permitting new pipeline construction in the U.S. Canadian oil sands also face widespread environmental criticism. Because the oil sands are viscous oil, thick and tar-like in nature, they require more intensive extraction techniques than conventional crude oil and in turn emit more greenhouse gases (GHGs) than some conventional crude oils. Currently, 55 percent of oil sands output is produced through surface mining and 45 percent is extracted through in situ operations. Mining causes more damage to the land and uses larger volumes of water than in situ production, but in situ operations emit more GHGs because of the large volumes of natural gas used in the production process. However, in situ technology offers considerable opportunity to reduce GHG emissions and is expected to exceed mining production in the future.
Although Canada’s oil sands are more energy intensive to produce and therefore emit more greenhouse gases than conventional petroleum production, a decision to deny the pipeline expansion request will likely have little effect on the ultimate volume of produced Canadian oil sands. Canadian producers are required to follow all local and national environmental standards in their onsite operations. Furthermore, Canadian producers could chose to export their production into alternative markets should access to the U.S. market become restricted. The Pacific Rim is a likely alternative market, particularly China.
Given the long term U.S. requirement to maintain a high level of crude oil imports from the world market, any lost sales of Canadian oil sands to the U.S. will be replaced by imports from alternative suppliers. Additionally, Canadian oil sands represent a significant source of current and future revenue for Canadian provincial governments as well as invested companies. Over 100,000 people are employed by oil sands production in Canada and this number is expected to increase six-fold in the coming decades. Because of a long tradition of open trade between the U.S. and Canada, U.S. oil service, equipment, and manufacturing companies will have growing export opportunities as Canadian oil sands development proceeds.
U.S. Canadian Energy Relationship
The United States and Canada maintain ties in security, border cooperation, trade, and investment. The signing of NAFTA (North American Free Trade Agreement) in 1994 only strengthened the economic ties between the two nations, resulting in a near six percent increase in trade each year since the signing and a two-way merchandise trade growth of 265 percent. U.S. companies have made substantial investments in Canadian mining and smelting industries, petroleum, chemicals, machinery, transport equipment, manufacturing, and finance. Additionally, Canada is the number one supplier of oil to the Unites States and provides 90 percent of natural gas imports (15 percent of U.S. consumption), significant volumes of uranium, and almost all imported electricity.
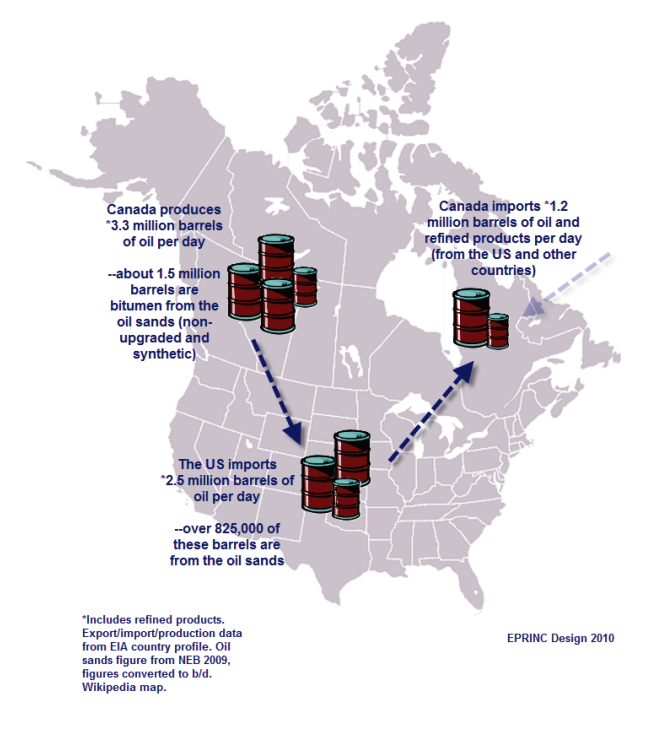
Figure 2 below illustrates the flow of crude oil and petroleum products between the United States and Canada. The majority of Canadian oil exports are shipped to the United States, but the U.S. also exports large volumes of refined products to Canada. The U.S. imports 2.5 million b/d of Canadian crude—825,000 b/d are from the oil sands. The oil sands constitute the majority of Canada’s incremental oil production potential which means that additional exports to the United States in the future will come predominately from the oil sands.
Figure 2. Canada’s Net Oil Imports and Exports to the United States
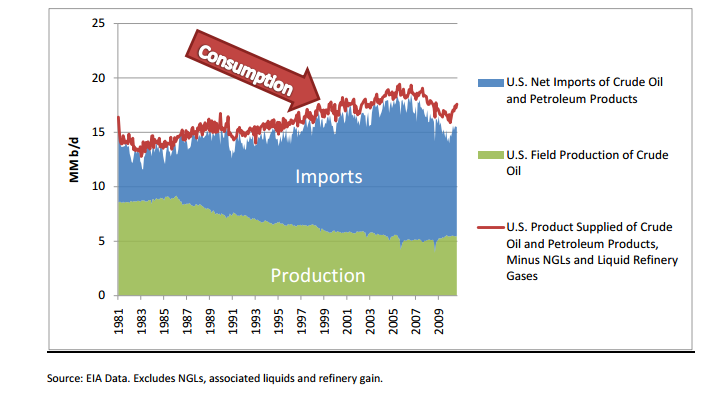
Some critics of Canadian oil sands production have recommended that the U.S. restrict imports from Canada and seek to replace the imports with alternative fuels and conservation. However, this strategy is a false choice. Alternative fuels can reduce net imports of crude oil and petroleum products, but these alternatives (biofuels, electric vehicles, natural gas vehicles, new auto fuel standards) offer only limited opportunity to substantially lower oil imports in the near to medium term. Even under the most optimistic scenario for using alternative fuels and technologies, the U.S. will import large volumes of petroleum in the next 10-20 years (see figure 3 below). If U.S. refiners are denied access to Canadian oil sands production, Canadian bitumen blends will likely flow to alternative markets, displacing crude supplies which would eventually make their way to U.S. import centers. Total Canadian production and total U.S. imports will likely remain the same with or without U.S. imports of oil sands from Canada.
Figure 3. U.S. Oil Production, Consumption, and Imports
Estimating the Economic Benefits of the Keystone Expansion Project
Additional imports of Canadian oil sands will provide substantial and long-term operating efficiencies for the U.S. refining sector, an industry characterized by declining margins in recent years.
Many U.S. refiners are able to maintain profitable margins when they can take advantage of the price spread between light and heavy crude oil. On average, most large U.S. refineries are complex. They were designed for and are capable of processing heavy crudes and producing a light product slate (dominated by transportation fuels), taking advantage of the light heavy crude price spread. When this spread is large, complex refineries purchase heavy crude at a discount to light crude and are able to produce a product slate commensurate with that coming from the refineries processing lighter, more expensive crudes, thus maximizing profit. However, when the spread collapses-as it has recently-and there is very little discount between heavy and light oil, heavy refiners are unable to realize any benefits from purchasing heavy crudes. They become less profitable, suffer underutilization, and forgo revenue.
The following chart shows prices for three grades of crude oil: a light-medium blend, a heavy blend, and Canadian bitumen from the oil sands. As illustrated below in Figure 4, bitumen typically sells at a small discount to heavy crude oil.
Figure 4. Prices for Light-Medium, Heavy, and Bitumen Crude Oils
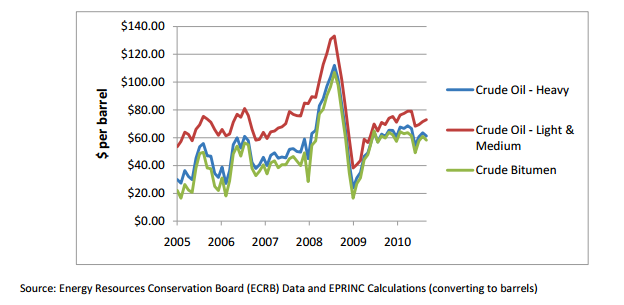
Figure 5 shows the discount at which heavy crude oil and bitumen sell to a light-medium blend. It should be noted that not only is the spread near a trough since 2005 in terms of dollars per barrel, but it also represents the smallest percentage discount since 2005 (and many years previous). This tight spread has important cost implications for a large segment of the U.S. refining fleet which are capable of processing heavy crudes.
Figure 5. Heavy Crude and Bitumen Discounts to a Light-Medium Blend
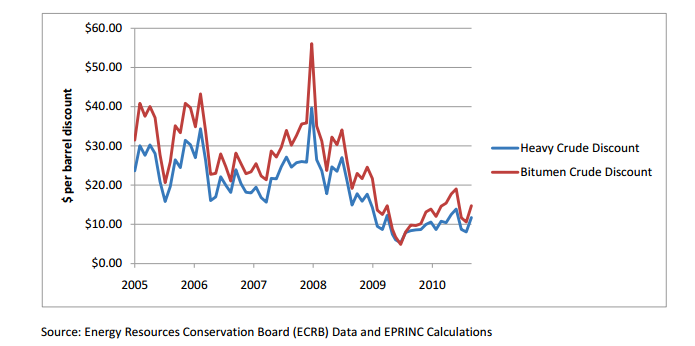
Figure 6 below shows the discount required for a refinery to break even while processing a given heavy feedstock. The horizontal axis represents the discount of a given crude oil (heavy or dilbit) to a light-medium blend in dollars per barrel and the vertical axis shows a refinery’s net margins (refined product value minus feedstock and operating costs). The red line shows the average margins for a refinery processing a light-medium feedstock. Because such a refinery is using the highest cost crude, it is not affected by the spread, and therefore its margins are constant. However, refineries processing heavy crude (green line) and dilbit (blue line) (also referred to as blended bitumen, bitumen blended with a natural gas liquid such as condensate) are affected by the spread. Because they have higher operating and capital costs and produce a slightly less valuable product slate (which can vary depending on the gravity and dynamics of their feedstock), they require a certain discount to operate profitably. When the discount is small, refineries that process mainly heavy crudes might operate at a loss; however, as the spread grows, the discount can widen enough to offset costs as well the lower product values, putting the complex refinery in a more profitable position.
Figure 6. The Crude Spread and Refinery Profitability
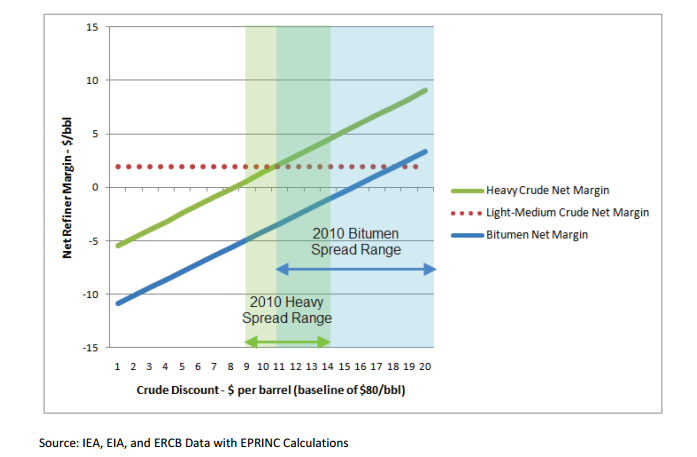
Figure 6 above puts into perspective the potential benefit of the oil sands to U.S. refiners. If the production of several hundred thousand barrels of additional blended bitumen has any effect on the crude spread, it will be to widen it. To what extent is difficult to estimate, but as Figure 6 shows, if it opens the spread by $1 or $2 per barrel it will have significant (positive) implications for the profitability of U.S. refiners.
Understanding the Collapsed Spread: Canadian oil sands offsetting heavy crude declines
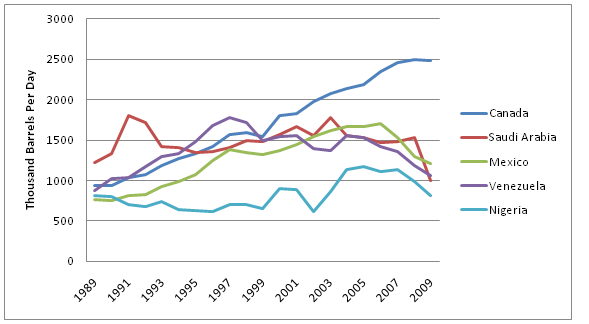
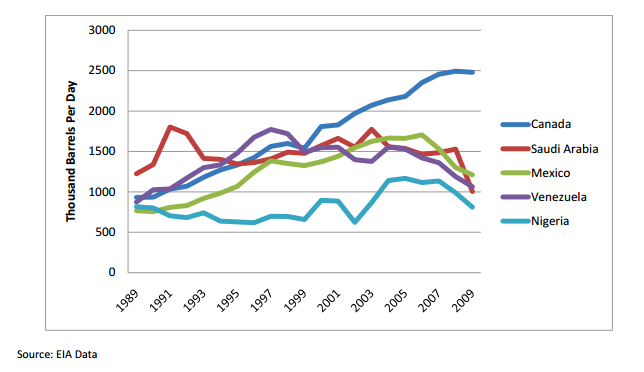
As traditional supplies of heavy crude from countries such as Mexico and Venezuela decline, Canadian oil sands become more important to the United States. A major factor driving historic investment in heavy processing capacity was the expectation that heavy crude oil supplies would remain abundant. Mexico and Venezuela produce predominantly heavy crude oil and have historically been two of the largest suppliers of crude oil to the U.S. Yet each have experienced drastic production declines over the past few years, removing significant volumes of expected heavy crude oil from the market, and creating at least one important driver of the tightened spread. As shown in Figure 7 below, Mexico, Venezuela, and Saudi Arabia have been supplanted by Canada as the U.S.’ largest source of crude oil imports.
Figure 7. U.S. Imports of Crude Oil and Petroleum Products by Country
The pipeline extension by TransCanada enables the U.S. to import an additional 509,000 b/d
of Canadian oil sands. In the past, pipelines have sent the majority of Canadian oil sands to PADD II (Petroleum Administration Defense District) due to the lack of pipeline infrastructure to PADD III and because PADD III has been primarily serviced by heavier crudes from Mexico and Venezuela. The Keystone XL project would extend down into the Gulf Coast states; the most densely populated refining PADD in the U.S. (see map in figure 8 below). PAD III is currently the most underutilized refinery market for Canadian oil sands because PAD III has 56 refineries and a capacity of over 8 million b/d—with 3 million b/d of heavy capacity. Additional volumes of heavy crude from the Keystone project, in the form of blended bitumen, will offset at least in part, declines in heavy Mexican and Venezuelan crude, supporting the economic fundamentals of the U.S. refining complex.
Figure 8. Current Oil Sand Imports to PADD II and PADD III
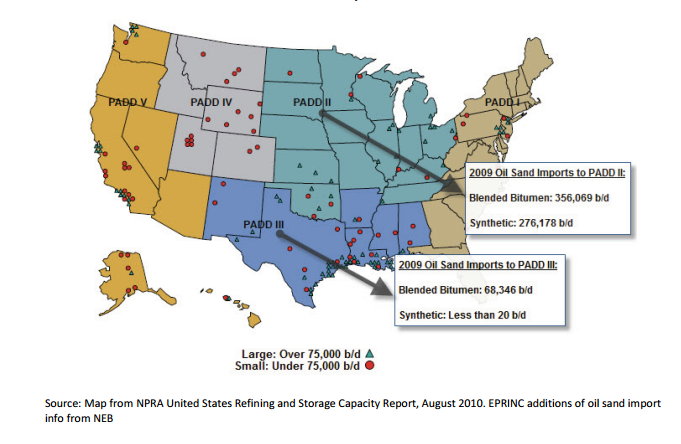
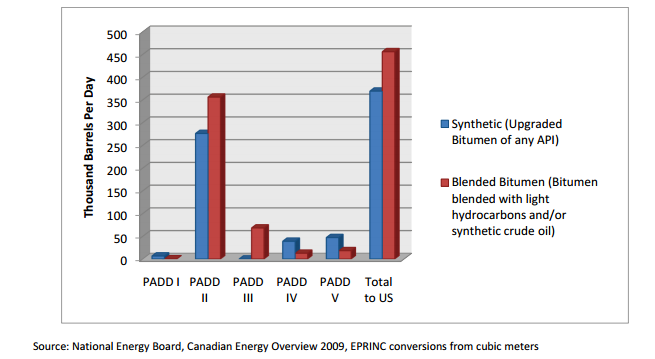
Figure 9 shows exactly how much blended bitumen and synthetic crude from the oil sands are going to each PADD.
Figure 9. Canadian Oil Sand Exports to the United States by Type and Destination in 2009
Canadian Upgrading and Synthetic Crude
In 2009, crude bitumen production from mining and in situ operations was 1.27 million b/d (before being processed). When compared to 2008, 2009 in situ bitumen production rose by 11 percent for a total of 648,000 b/d. Production in 2009 from mining operations rose by 14 percent to a volume of 765,000 b/d. Roughly 9 percent of the in situ produced bitumen was upgraded into a synthetic crude oil while all of the mined bitumen was upgraded. Of the oil sands processed in the U.S., 55 percent was blended bitumen and 45 percent was SCO (synthetic crude oil).
Much like U.S. refineries, companies operating in the oil sands have an incentive to capitalize on a light heavy crude price spread. Some Canadian producers would prefer to upgrade the raw bitumen into synthetic light crude and take advantage of the resultant higher value. However, given the convergence of heavy light valuations, the incentive to upgrade larger volumes of Canadian oil sand output remains low. Upgraders, like complex refineries, are very capital intensive; without a substantial light heavy value spread there is little economic incentive to build such facilities. While there is a push by the government of Alberta to increase upgrader capacity, most Canadian oil sand producers will realize higher wellhead values by selling non-upgraded bitumen into the U.S. market. An NEB (National Energy Board Canada) 2006 report estimated that by 2015 sixty-five percent of all oil sands production would be upgraded into synthetic crude oil; however, at that time the differential was around $20.
Given the lack of a substantial differential in light and heavy crude values, future upgrading capacity is not likely to meet these estimates. In 2005 the NEB estimated the supply costs for different types of oil sands production (supply costs include operating cost as well as capital costs, taxes, royalties, and the rate of return on the investment). Mining and Steam Assisted Gravity Drainage (SAGD) (a typical form of in situ production), were the same in terms of supply cost: between US$17 and US$20 per barrel. However, integrated mining/upgrading had a supply cost of US$33 to US$37 per barrel. This suggests that upgrading costs an additional US$16/bbl. Without a significant light heavy crude differential, upgrading is simply too costly. These factors along with rising capital costs for oil sands development may prevent continued expansion in upgrading capacity and support bitumen blending.
TransCanada Tapping into Bakken Crude: Adding additional efficiency in oil transport
TransCanada’s Keystone expansion project has the potential to link light-sweet Bakken crude from the Williston Basin (North Dakota, Montana, and Saskatchewan) to Gulf Coast refineries for the first time. While the Bakken currently has sufficient oil transport capacity via a combination of truck, rail and pipeline, recent bottlenecks have caused price discounts up to $11 in 2008 due to the regional distance from markets. Bakken oil production is expected to grow and will benefit from additional low cost shipping capacity to major refining centers.
TransCanada is currently obtaining commitments from interested Bakken producing companies wishing to utilize the Bakken Marketlink Project. This “binding Open Season” comes after a positive “expression of interest” and discussion phase which took place earlier this year. This additional pipeline access would give Bakken producers access to Oklahoma and Gulf refineries. TransCanada plans to follow through with appropriate regulatory procedures and have the project commenced in early 2013.
Current volumes of Bakken production can be accommodated without large losses in wellhead values. Three hundred and thirty-seven thousand barrels each day are sent via pipeline, 30,000 b/d are transported via rail, and 22,000 b/d are trucked north into Canada. While rail and trucking options allow companies to tap into niche markets and have allowed some to rapidly respond to production growth, pipelines are typically less expensive on average and are a more efficient mode of shipment. Additional pipeline access will play an important role in preventing deterioration in long-term wellhead values throughout the Bakken producing region.
EPRINC’s Estimation of Net Economic Benefits
Figure 10. Annual Benefits of Keystone XL to Gulf Coast Refiners and Bakken Producers
Appendix A: Alternative Markets for the Oil Sands
While a transportation system to export Canadian oil sands to other regions of the world has not been established, there has also not been a need to aggressively pursue alternative markets given the large U.S. market and relatively low cost transportation opportunity. Considering the oil sands enormous value to Canada, both in revenue and employment, denial of access to the U.S. market would result in an aggressive program to ship the resource to alternative markets.
Chinese involvement in the oil sands suggests a potential alternative market for the oil sands should the U.S. choose to decline or halt additional imports. In April 2010 China’s largest refiner, Sinopec, became a stakeholder in Syncrude Canada Ltd. by purchasing ConocoPhillips’ 9.03 percent share for $4.65 billion. PetroChina agreed to buy a 60 percent stake in two oil sands properties (not yet developed, but with the potential to produce up to 50,000 b/d) from Athabasca Oil Sands Corp in the fall of 2009. In May of 2005 Sinopec purchased a 40 percent stake in Total SA’s undeveloped Northern Lights project for $105 million and the company purchased an additional 10 percent in April of 2009. CNOOC Ltd purchased 16.7 percent of MEG Energy Ltd, a privately held company working on oil sands developments in northern Alberta with prospects of 210,000 bpd, in April 2005. Also in April of 2005 Enbridge and PetroChina agreed to a planned pipeline which would send Canadian oil sands to the Pacific Coast of British Colombia. Enbridge is still in the planning phases of the pipeline, but PetroChina has since withdrawn from the project. Recent reports suggest lackluster enthusiasm from British Colombia municipal governments for such a pipeline as it would cross through their territories. They are widely opposed to an overland pipeline and well as tanker traffic along the coast. But if supplies to the U.S. hit a bottleneck, one can expected renewed interest in a Pacific export route.