
The NYT’s reporter relied extensively on anecdotal evidence and commentary on developments in the natural gas industry from both industry and government officials (often unnamed sources), focusing on concerns that the prospect of production increases in natural gas output have been overblown. Concerns were also raised about investments failing due to low natural gas prices and that the promise of growing output of new supplies of natural gas were problematical. The reporter pointed out that, if natural gas ultimately proves more expensive to extract from the ground than has been predicted, landowners, investors and lenders could see their investments falter, while consumers will pay a price in higher electricity and home heating bills.
The concerns raised by the reporter are legitimate subjects for a newspaper story, but the central question is whether they convey an accurate perspective on the current role and prospects of natural gas in the national economy. This very issue has been the preoccupation of an army of analysts and experts who have worked to develop estimates of both costs and future supply of natural gas. These assessments are readily available to the public and the New York Times. The article also fails to mention the bonanza of economic benefits that shale gas has already provided the economy.
Petroleum development is inherently risky, as markets are volatile and exploration and production face a host of unknown outcomes. But developments in these markets are also subject to systematic analysis and data driven conclusions. The author’s reporting, which is based primarily on speculative emails from companies and outside analysts, many from 2008 and 2009 are not supported by careful research from well respected experts, many independent of the industry. Industry experts have openly recognized and debated uncertainties regarding shale gas production for several years. The purpose of this EPRINC note is to review shale gas production over the past several years, the benefits already bestowed upon the U.S. economy and where the industry stands today.
Available data on shale gas does not point to a severe crisis in either the prospects for future production or the viability of the industry. Among the more important developments are:
1) The shale revolution has already brought tangible benefits to the U.S. economy through significantly lower and less volatile natural gas prices, reduced gas imports, and increased employment. Gas consumers have likely received at least $200 billion in direct benefits as a result of lower gas prices. Additional economic stimulus has been generated from royalties and taxes, a reduction of the U.S. trade deficit and renewed growth in the American petrochemicals industry.
2) Shale gas production will likely account for over 35% of total U.S. production in 2011, increasing from 14.2 bcf/d (billion cubic feet per day) in 2010 to 22.5 bcf/d in 2011.
3) Technological progress and experience with varying shale formations have led to more economic and efficient drilling practices. Shale gas production continues to grow rapidly despite the U.S. gas rig count being at half of its 2008 peak. Shale producers have dramatically increased the productivity and efficiency of their drilling operations while improving well flow management.
4) Decline rates and initial production rates have improved over time as companies enhance their drilling techniques.
5) The June 25 article allots one sentence to discussion of associated liquids. Many shale wells produce associated liquids which are often more valuable gas, i.e. the well is producing a joint product lowering the break even production cost of the shale gas.
6) Companies are using drilling techniques, perfected in shale gas plays, and transferring them into liquid rich shale plays such as the Bakken and Eagle Ford. Due in large part to such plays, U.S. oil production is at its highest point in nearly a decade, more than offsetting lost Gulf of Mexico production resulting from the Macondo spill fallout.
Table 1. Shale Gas Driving U.S. Gas Production Growth Despite Declining Conventional Production
| 2007 | 2010 | 2011* | 2007-2011 Change % | 2011 % of U.S. Dry Gas Supply | |
| Total U.S. Dry Gas Production (bcf/d) | 52.8 | 59.1 | 61.3 | 16.54% | |
| Conventional Gas Production (bcf/d) | 48.1 | 42.5 | 38.8 | -19.33% | 63.30% |
| Shale Gas Production (bcf/d) | 4.5 | 14.2 | 22.5 | 400.00% | 36.70% |
Source: EIA Data, EPRINC Calculation for 2011 Shale Estimate. Sum of conventional and shale supply may not equal total dry production.
Where would we be without shale gas? Paying more and importing more.
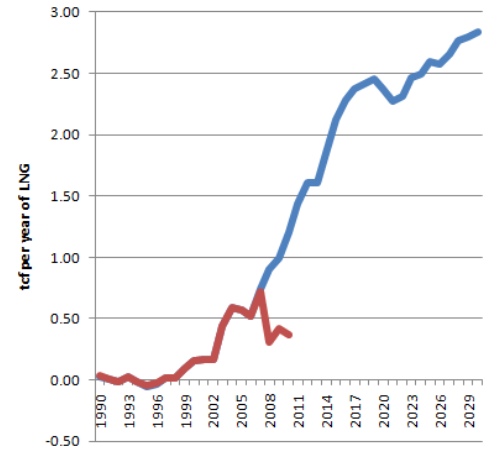
As of 2009, the U.S. had approximately 4.5 tcf (trillion cubic feet) per year of LNG (liquified natural gas) import capacity. About 75% of that capacity was built between 2005 and 2009 based on expectations that U.S. domestic output was in decline and that the U.S. would be required to import LNG from abroad to meet demand. In its 2008 Annual Energy Outlook, EIA (Energy Information Administration) projected 2009 net annual LNG imports of 1 tcf, growing to 1.2 tcf in 2010. It was not necessarily a bad forecast, as evidenced by the rapid growth in LNG receiving capacity during the 2000′s. But today, 90% of U.S. LNG import capacity sits idle. In 2009 the U.S. imported approximately 0.45 tcf of LNG, 10% of annual import capacity. LNG imports declined in 2010 to 0.37 tcf.
Figure 1. Actual LNG Imports vs. the 2008 EIA Forecast

Source: EIA Data form the 2008 Annual Energy Outlook
Shale gas production is largely responsible for this reduction in imports (and the reduction in pipeline imports), which are at their lowest level since 1999. Despite natural gas consumption growing from 2000 to 2010, wellhead values in 2009 and 2010 were at their lowest levels since 2002, due in large part to marketed domestic production growing 11.7% from 2000 to 2010. In 2010 shale gas accounted for almost 25% of U.S. production, up from 1.3% in 2000, and will grow to over 35% in 2011 even as the U.S. natural gas rig count is at about half of its 2008 peak and conventional production continues to decline.
Figure 2. U.S. Gas Production, Consumption and Prices

Source: EIA Data
Certainly the recession dampened both natural gas demand and prices, but the supply surge from shale gas cannot be dismissed. Last year shale gas helped the U.S. surpass Russia as the world’s largest producer of natural gas. In 2010 the U.S. consumed 24.1 tcf of natural gas –a historic high. Yet imports continued to decline and Henry Hub spot prices remained below $5/MMBTU (per million British Thermal Units) for the second consecutive year. The supply surge has been so significant that oil and natural gas prices have decoupled in the U.S., meaning oil and natural gas prices no longer closely track each other as they had historically. They began decoupling in 2006 as figure 3 shows, well before the recession began and two years before oil peaked above $140/bbl.
Figure 3. U.S. Benchmark Oil and Gas Prices

Source: EIA Data, EPRINC Calculations
BOE = Barrels of Oil Equivalent
To estimate what the U.S. might pay for gas today without the shale gale we can look to Europe. In Europe, natural gas prices largely follow oil prices as they used to in the U.S. just five or six years ago. Much of the European natural gas supply is imported from Russia with long-term contracts directly tied to the price of oil. And while U.S. shale supplies have put downward pressure on European supplies by diverting LNG cargoes which would have been consumed in the U.S. to the European spot market, European spot prices remain significantly higher than those in the United States.
Figure 4. U.S. and UK Benchmark Gas Futures Prices

Source: Energy Intelligence data, June 29.
The difference between UK and U.S. futures prices ranges from $3.60 – $6.63/MMBTU in the forward months, more than double the current Henry Hub spot price for most months. Current UK spot prices resemble U.S. spot prices prior to the shale gas boom and provide a reference point for considering where U.S. prices would be had shale gas supplies never materialized. But even a conservative estimate of the savings, $2-$4/MMBTU compared to a zero shale supply scenario, show substantial economic benefits for the U.S. economy. The following table shows 2010 U.S. natural gas consumption in the four largest gas consuming sectors and the direct savings to those sectors as a result of gas prices being $2 or $4/MMBTU lower as a result of the shale supply surge.
Table 2. Direct Fuel Cost Savings to U.S. Natural Gas Consumers
| 2010 Consumption (tcf) | Savings at $2 per MMBTU discount | Savings at $4 per MMBTU discount | |
| Residential | 5 | $10 billion | $20 billion |
| Commercial | 3.2 | $6.4 billion | $12.8 billion |
| Industrial | 6.6 | $13.2 billion | $26.4 billion |
| Electric Power | 7.4 | $14.8 billion | $29.6 billion |
| Total in Four Major Sectors | 22.2 | $44.4 billion | $88.8 billion |
Source: EIA data, EPRINC Calculation. Note: Cost pass through varies by sector, EPRINC assumes consistent pass through for this table.
Savings for 2010 alone range from $44.4-$88.8 billion dollars for the given sectors. Considering natural gas prices have been decoupled from oil by more than $10/BOE since 2006 and natural gas spot prices remain below $5/MMBTU today, it is likely that the U.S. economy has already saved at least $200 billion from lower gas prices as a result of new shale gas supplies. Industry employment, taxes, royalties and bonus payments to lease holders, a reduction of the U.S. trade deficit, and renewed growth in a stagnant petrochemical industry provide additional economic benefits.
Shale Production Still Evolving: Production Rates and Liquids
Much has been made in the New York Times’ shale gas series about the high decline rates prevalent among shale gas wells. Many of the emails, particularly those from 2008 and 2009, suggest that rapid production decline rates will eventually make shale drilling uneconomic. As noted earlier, decline rates have publicly been and continue to be a major concern for shale gas producers. However, the New York Times series fails to mention several data points which suggest that decline rates are not quite the concern they were several years ago. Shale gas production technology and techniques are not static but instead are continually evolving.
The following data was compiled by Advanced Resources International, Inc. and shows the evolution of new shale well IP (initial production) rates and 30 day production rates along with the average lateral length (the horizontal length) of a new well. Longer lateral lengths coupled with additional fracking stages and a better feel for shale play sweet spots have combined to shift the shale production curve upwards: shale wells have higher IP rates, less steep decline rates and higher cumulative production. These methods have successfully transferred over to shale oil plays as well.
Table 3. Improvements in Shale Well Production and Decline Rates
| New Wells on Production | Average IP Rate (Mcf/d) | Average 30th Day Rate | Average Lateral Length | |
| Q1 (First Quarter) 2007 | 58 | 1260 | 1070 | 2100 |
| Q2, Q3, Q4 2007 | 197 | 1770 | 1490 | 2750 |
| Q1 2008 | 75 | 2340 | 2150 | 3300 |
| Q2, Q3, Q4 2008 | 244 | 2920 | 2480 | 3720 |
| Q1 2009 | 120 | 2990 | 2540 | 3870 |
| Q2, Q3, Q4 2009 | 326 | 3670 | 2720 | 4170 |
| Q1 2010 | 106 | 3200 | 2390 | 4350 |
| Q2, Q3 2010 | 288 | 3360 | 2510 | 4520 |
| Q1 2007 -> Q2/Q3 2010 % change | 166.67% | 134.58% | 115.24% |
Source: Advanced Resources International, Inc., http://www.acus.org/files/EnergyEnvironment/Unconventional25Jan/Vello_Kuuskraa.pdf, EPRINC calculations.
Despite the decline in the gas rig count as many move to liquid rich shale plays, shale gas production has grown every year since 2006 and EIA expects growth in 2011 and onwards. Production growth with a reduced rig count certainly supports a conclusion that decline rates are improving. But it also points to growing efficiency in the shale gas industry. Improvement in drilling times over the past several years means fewer rigs are needed to maintain drilling progress. More wells can be drilled with fewer rigs. Operators have honed techniques over the past several years to reduce drilling times from over 30 days per well to around 10 days per well. This also reduces drilling costs, making shale gas development more efficient and economic. Technology such as multi-well pads are becoming more popular. Several wells can be drilled from one multi-well pad, thus reducing drilling costs and times as well as the environmental footprint.
Figure 5. U.S. Rig Counts and Natural Gas Production

Source: Baker-Hughes Data, EIA Data, EPRINC Calculation for 2011 production estimate
Natural gas sales are not the only source of income for shale gas producers. Many shale gas producers have hedged their production against lower prices and are effectively receiving a higher price for the gas than the nominal spot price. However, hedging will not provide price relief in a persistently low-price environment. But more important than hedging, shale gas has changed U.S. liquids production in two important ways. Many shale gas producers and other independent companies are transferring their experience to shale oil plays, reversing decades of U.S. crude oil production declines.
The Bakken shale oil formation in North Dakota has been tapped through a combination of hydraulic fracturing and horizontal drilling. It is now the fourth largest oil producing state in the U.S. at over 350,000 bbl/d and has the nation’s lowest unemployment rate at just 3.2%. But shale gas producers are also producing liquids directly from their shale plays. Natural gas liquids (NGLs) are produced in certain shale plays alongside dry gas and generally fetch a price closer to that of oil than gas. This provides additional income to shale gas producers and is showing signs of rejuvenating the U.S. petrochemical industry, much of which has moved to Asia. Plans are underway to build new petrochemical facilities in the Gulf Coast and in West Virginia. The following chart shows gas processing and NGL extraction at gas processing plants through 2009; 2011 NGL production will likely come in significantly higher. In 2009 the U.S. produced about 2 MM bbls/d of NGLs, some of which are used as refinery feedstock and offset crude oil imports.
Figure 6. U.S. NGL Production

Source: EIA Data