
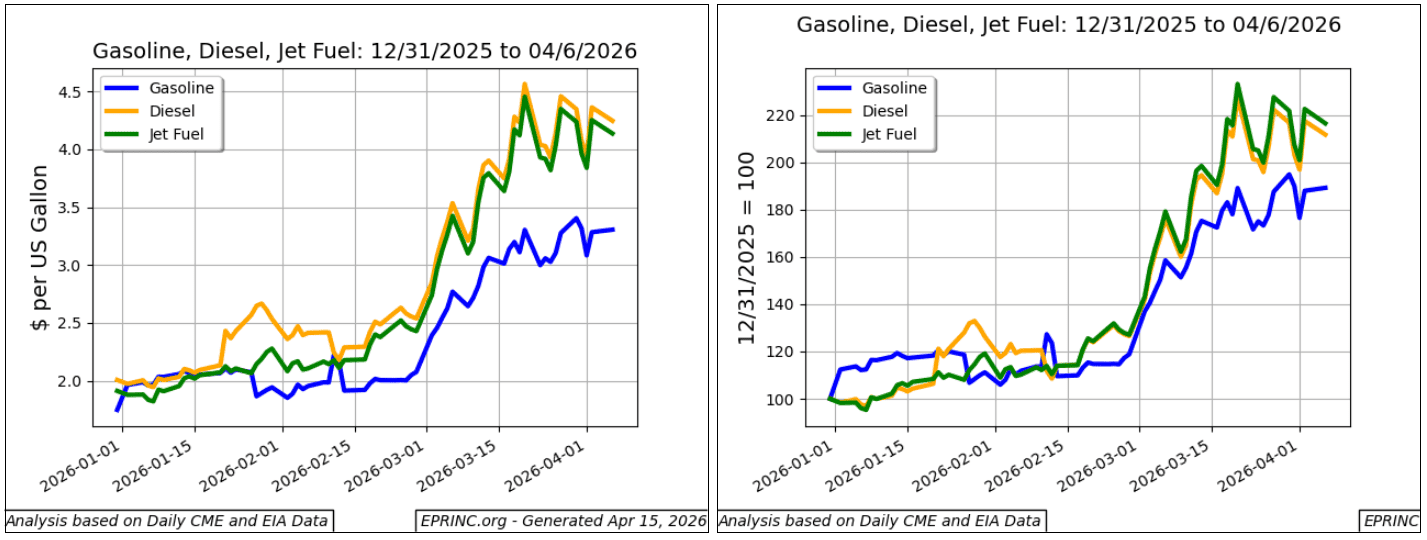
The Israel/U.S.–Iran war that began on February 28, 2026 has led to the closure of the Strait of Hormuz, a critical chokepoint for the flow of hydrocarbons as well as nitrogen-based fertilizer and helium, raising the threat of shortfalls across dependent countries in Europe, Africa, and Asia. This chart examines how that disruption is transmitting into U.S. fuel prices. EPRINC has consolidated its coverage of the crisis in its Special Focus: Crisis at the Strait of Hormuz.
Given its substantial domestic production, the United States is considerably autarkic and has been relatively insulated from these physical shortfalls. Even so, commodities such as fuels that are exposed to and actively traded on global markets remain subject to price impacts from the closure.
At the wholesale level, U.S. diesel and jet fuel benchmarks have each risen $1.71 since the end of February, to $4.25 and $4.14 per gallon (67.3% and 70.3%, respectively). The gasoline benchmark increase has been considerable but less pronounced, rising $1.23 to $3.31, or 59%.
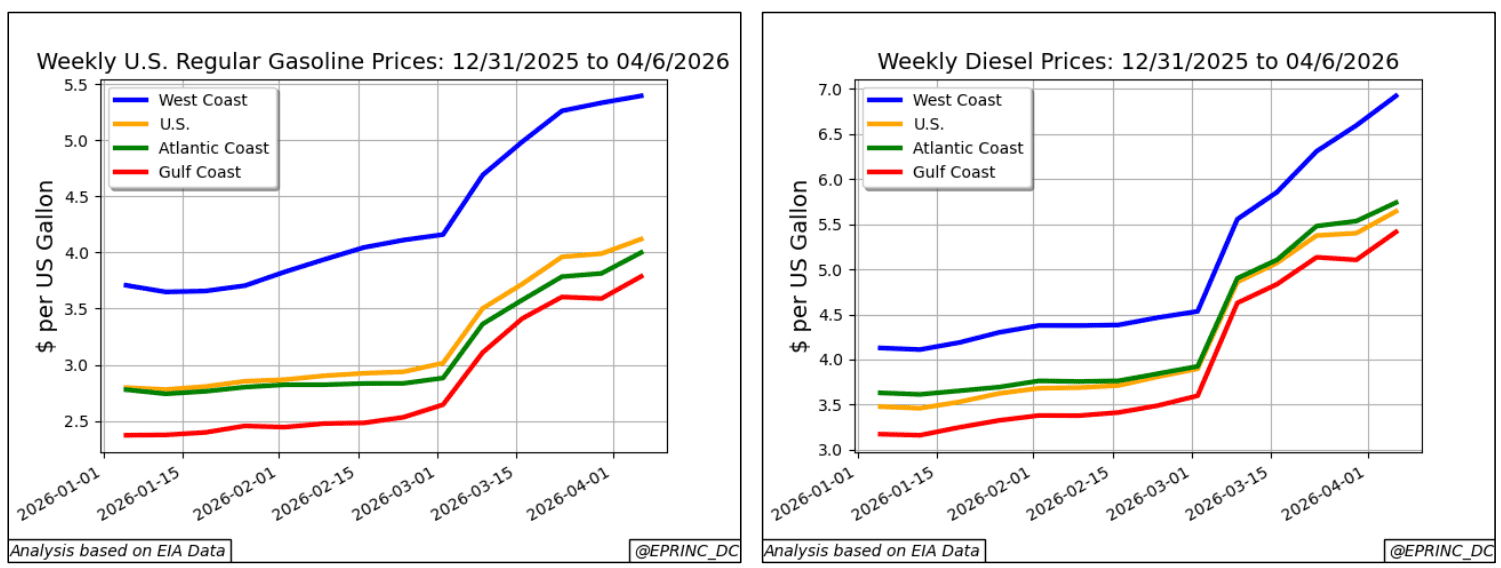
U.S. retail prices vary regionally, reflecting the stringency of various regulations and geographical proximity to refineries, which affects freight costs to filling stations. West Coast prices are consistently the highest in the nation: since the end of February, West Coast gasoline and diesel rose 31.3% and 55.1% to $5.40 and $6.92 per gallon, and at the beginning of April carried a $1.28 premium over the national average for both fuels.
Nationally, gasoline and diesel prices have risen 40.3% and 48.1% since the end of February, to $4.12 and $5.64 per gallon. Gulf Coast retail prices, in the region where roughly half of U.S. refining is located, sat $0.33 and $0.23 below their respective national averages, yet were still up 50% and 55.2% over the same period.
Published April 4, 2026, EPRINC Research Director Max Pyziur was quoted in La Tercera, one of Chile’s leading national newspapers, in a piece surveying how the Strait of Hormuz closure is reshaping daily life around the world. An English translation is also available.
From the EPRINC Chart of the Week archive.
Cite: EPRINC, “Strait of Hormuz Closure: Gasoline and U.S. Fuel Prices,” Chart of the Week 2026-15, April 6, 2026.