EPRINC has undertaken an assessment of recent trends in the flaring of natural gas in North Dakota and concluded the following:
1) Total flaring volumes will likely decline now that many companies have met leasing requirements and are beginning infill drilling and holding acreage by production. Many leases signed at the beginning of the boom (2007-2008) required companies to drill wells and begin production within a short period of time, typically 3-5 years. Companies had to produce oil in order to hold their leases. The necessary infrastructure to capture and sell the gas was unable to keep pace with such rapid development.
2) There may be some temporary increases in flaring as infrastructure is connected to new wells. These increases are the direct result of connecting new wells to existing gas gathering pipelines. Existing wells connected to gathering systems often need to be temporarily disconnected from the gas pipeline network and allowed to flare as newer wells with higher production volumes are incorporated into the pipeline network. Existing producing wells cannot be safely disconnected from the pipeline network unless flaring is permitted.
3) In North Dakota, associated gas is of high value because it is rich in natural gas liquids (NGLs), providing a strong financial incentive to capture the associated gas. However, because the technology to process NGLs is more costly and complex than the infrastructure required to capture dry gas, it will likely take longer to bring about major reductions in natural gas flaring. Nevertheless, large-scale deployment of new gas processing equipment is now underway in North Dakota.
4) Calculations by EPRINC show that if all flaring were halted in North Dakota, the pace of crude oil production would be delayed substantially. Although prohibiting flaring would preserve currently burned natural gas and NGLs for future sale into the U.S. pipeline and product network, the financial penalties associated with delaying oil production outweigh the benefits from gas savings for two reasons: 1) Crude oil is more valuable than gas (even gas that is rich in NGLs) and 2) The financial penalty from delayed oil production exceeds the financial losses of flared gas. If a prohibition on natural gas flaring delayed oil production by just three years or five years, the present value financial loss would be $36 billion and $50 billion respectively for North Dakota alone. Policy prohibitions on flaring would have to weigh these losses against any gains in environmental protection and saved gas. Such a policy would have to conclude that the environmental benefits of prohibiting flaring would outweigh the economic costs of delayed oil production. However, the losses in natural gas production are not trivial and clearly justify policy strategies which shorten the time to build out the natural gas infrastructure.
I. Introduction: North Dakota’s Infrastructure Challenges
Public concerns about flaring have led to suggestions that it should be prohibited even if it means permanently or temporarily halting crude production. A decision to flare natural gas is made because it enables the production of the more valuable crude stream until associated gas capturing infrastructure is installed. Producers prefer to extract as much value from their wells as possible by capturing and selling both oil and associated gas, but this is sometimes prevented by infrastructure constraints.
The large disparity between crude oil and natural gas prices is at a historic level; crude oil is valued over 30 times that of natural gas based on energy content.
Figure 1. Crude Oil and Natural Gas Spot Prices

Source: EIA data, EPRINC calculations
Associated gas in North Dakota is more valuable than in many other U.S. oil plays (see figures 11, 12, and 13). The associated gas co-produced with oil in Bakken wells is very rich in natural gas liquids (NGLs) and therefore has a much higher value than dry gas sold at Henry Hub prices. However, because the gas is rich in NGLs, it also requires large capital investments to build processing infrastructure to strip out the valuable NGL components.
Flaring in North Dakota has grown rapidly because of the recent growth in oil production, and therefore growth in associated gas production. Since January 2008 oil production has risen by 500,000 b/d (barrels per day) and gas production (largely associated gas from Bakken wells) has risen by 500,000 mcf/day (thousand cubic feet per day). Associated gas production has outpaced the installation of gas gathering infrastructure including gathering pipelines from the wellhead and compressors (to compress the gas so that it can be transported down the pipeline), resulting in large gas volumes being flared.
Natural gas processing facilities, pipelines, and compressors are only one component of many lagging factors in the oil boom. There is also a lack of oil pipelines and infrastructure, manpower, housing, and roads. The entire range of services required to support the oil boom are in short supply. North Dakota has been an oil producing state for 60 years, but only during the past four years has the Bakken oil boom turned North Dakota into a major U.S. oil province. It is currently the second largest oil producing state in the country and one of the largest onshore plays in the United States. Bakken oil is conventional, light-sweet crude oil with an API gravity of 46 degrees.
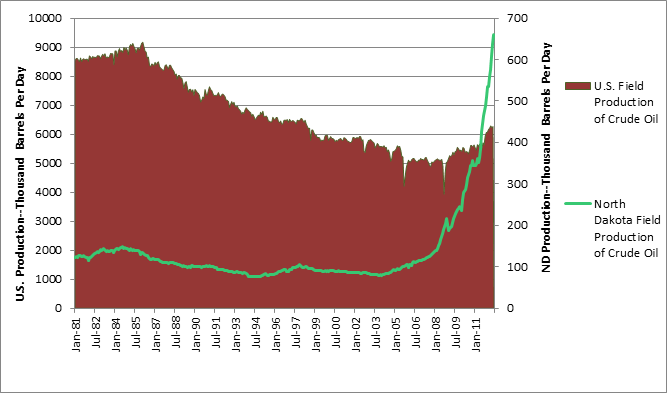
Figure 2 below illustrates the recent increase in U.S. and North Dakota oil production.
Figure 2. U.S. and North Dakota Crude Oil Production

Source: EIA, NDIC data
II. Associated Gas, Flaring, and North Dakota Regulations
Oil producers in North Dakota are targeting crude oil in the Bakken and Three Forks formations. North Dakota is producing 660,000 b/d of oil and about 713,000 mcf/day of gas as of June 2012. For every barrel of oil produced slightly over one mcf of associated gas is also produced. The vast majority of North Dakota’s produced gas is associated gas from oil wells. About one third of the produced gas is being flared.
Millions of dollars have already been deployed for natural gas infrastructure and $4 billion of investment is expected over the next several years. However, despite the large growth in gas capturing, gathering capacity has thus far failed to keep up with new flaring.
Flaring of gas is done by burning off the gas at the well site with a flare stack. Regulations in North Dakota allow for companies to flare gas from an oil well for up to one year before being forced to shut in the well, pay royalties, or connect it to natural gas gathering lines and facilities so it can be used for on-site power or sold into the market. Exemptions are permitted if a company can prove that it is not feasible to hook up the well to the necessary infrastructure. Unlike oil, which can be transported by pipeline, truck or rail, gas must be transported by pipeline and requires compression and then processing. Under the North Dakota Century Code section “38-08-06.4. Flaring of Gas Restricted-Imposition of Tax-Payment of Royalties-Industrial Commission Authority” the basic rules are stated as follows:
As permitted under rules of the industrial commission, gas produced with crude oil from an oil well may be flared during a one-year period from the date of first production from the well. Thereafter, flaring of gas from the well must cease and the well must be capped, connected to a gas gathering line, or equipped with an electrical generator that consumes at least seventy-five percent of the gas from the well. An electrical generator and its attachment units to produce electricity from gas must be considered to be personal property for all purposes. For a well operated in violation of this section, the producer shall pay royalties to royalty owners upon the value of the flared gas and shall also pay gross production tax on the flared gas at the rate imposed under section 57-51-02.2. The industrial commission may enforce this section and, for each well operator found to be in violation of this section, may determine the value of flared gas for purposes of payment of royalties under this section and its determination is final. A producer may obtain an exemption from this section from the industrial commission upon application and a showing that connection of the well to a natural gas gathering line is economically infeasible at the time of the application or in the foreseeable future or that a market for the gas is not available and that equipping the well with an electrical generator to produce electricity from gas is economically infeasible.
If deemed infeasible, the North Dakota Industrial Commission (NDIC) grants the right to the producer to continue flaring the well past a period of one year. The NDIC says it periodically follows the activity of many of these wells to see if the circumstances of the permit have changed. However, there are currently no regulations in place which require a mandatory follow-up.
Flaring (and or venting) is typically used in modern oil and gas facilities either for safety and pressure relief or for the disposal of associated gas due to the lack of capturing and processing facilities. It is necessary to have the option to flare for safety purposes in case there is a power outage or risk of explosion. Additionally, when new wells are being connected to gathering lines they are often producing more associated gas than older wells that have been connected previously. Due to the surge in new production, the older wells may need to flare for a period of time so the gathering lines can safely handle the new volumes from the newly connected well.
Flaring is most commonly seen in countries like Russia and Nigeria due to lack of enforced regulation, little economic incentive to capture the gas, as well as inadequate and aged infrastructure. The major concerns surrounding the flaring of natural gas are related to air emissions and contaminants, increasing GHG (greenhouse gas) emissions, and wasting a non-renewable fossil fuel. Flaring produces mainly CO2 emissions and venting produces mainly methane emissions. Methane has a significantly higher greenhouse effect than CO2. Venting gas is the process of releasing the gas stream directly into the atmosphere instead of burning or flaring it.
How much natural gas is being flared in North Dakota?
While new gathering lines and processing facilities are being put into place there still remains a large gap between gas produced and gas sold. Currently, about 36% of produced natural gas is not being captured. However, not all of this is attributable to flaring. Just over thirty percent (about 32%) of the produced natural gas in North Dakota is being flared. Between 2 – 3% of the unsold gas can be attributed to an enhanced oil recovery method, called fireflooding, being used in Bowman County.
Figure 3. Amount of Natural Gas Produced, Sold, and Not Sold (Flared + Fireflooding)

Source: Data from NDIC
Because over a hundred new wells come on line each month (147 new wells came online in the month of June 2012), the number of wells without gas sales (i.e. wells that are flaring) remains above pre-Bakken boom levels; however, the growth in wells with gas sales (i.e. wells that are capturing gas) has far outpaced the growth of wells without sales.
Figure 4. Number of Wells With and Without Gas Sales

Source: Data from NDIC
Figure 5. Number of Wells with First Time Gas Sales each Month

Source: Data from NDIC
Figure 5 indicates there is a steady increase in the number of new wells connected to a gathering system for the first time each month.
Due to the level of infrastructure investment, natural gas flaring in North Dakota may have peaked. However, a number of infrastructure developments must come together for flaring to be dramatically reduced. Each producing well must be hooked up to a gathering pipeline. The gas must then be sent to a compressor and then sent to a processing facility (gas processing plant). This process requires a great deal of planning, permitting, investment, and construction time.
III. Natural Gas Infrastructure Investment
Four billion dollars are being invested by the oil and gas industry for natural gas gathering and processing in North Dakota from now until 2017. Currently, natural gas processing plant capacity in North Dakota is keeping up with natural gas production, but there still remains a lag in flaring which indicates that there are infrastructure delays in the building of gathering lines to individual wells, likely due to rights of way and related construction delays (discussed more in next section).
Figure 6 below demonstrates how natural gas processing plant capacity has more than kept pace with natural gas production in North Dakota (and is set to continue this pace). The gas processing plants, which take in raw gas and separate out the NGLS, are being built in tandem with gas production; however, the individual gathering lines that hook up each well and send the gas to the processing plant are still lagging, creating high flaring volumes.
Figure 6. North Dakota Natural Gas Processing Capacity vs. Actual Production

Source: NDIC and NDPA raw data with EPRINC conversions
Figure 7 below shows planned investments for a variety of gas gathering and production infrastructure, from dry gas pipelines and compressors to gas plant processing facilities and NGL pipelines. Typically the state of North Dakota approves permits within a few months; however, permitting alone does not secure the necessary rights of way (needed by producers from landowners to build gathering pipelines from the wellhead).
Figure 7. Table of Projects and Investment Dollars
| COMPANY/*Project | Investment | Completion Date | Notes MMcfd = Million Cubic Feet Per Day |
| ——————————— | ——————– | ——————— | ———————————————————————————- |
| ONEOK | $1.9-2.2 Billion | ||
| *Bakken NGL Pipeline | $450-550 Million | Early 2013 | 60,000 bpd, 525 Mile Pipeline transporting raw NGLs from the Bakken to Overland Pass Pipeline in CO |
| *Bakken NGL Pipeline Expansion | $100 Million | Q3 2014 | Additional pump stations will increase capacity from initial 60,000 bpd to 135,000 bpd |
| *Stateline I Gas Plant | $300-355 Million | Q3 2012 | 100MMcfd, Williams County |
| *Stateline II Gas Plant | $260-305 Million | Early 2013 | 100MMcfd, Williams County |
| *Garden Creek II Gas Plant | $310-345 Million | Q3 2014 | 100MMcfd, adjacent to existing Garden Creek I plant |
| *Divide County Gathering System | $140-160 Million | Late 2013/2014 | 270 miles of pipeline bringing gas from Williston Basin producers to Stateline Facilities |
| NEW FRONTIER MIDSTREAM | $250 Million | New Frontier total natural gas investment, including South Heart Plant and Parallel Pipelines | |
| *South Heart Cryogenic Gas Plant | see company total | Spring 2013 | 40MMcfd, Stark County (near South Heart, ND) |
| *Parallel Pipeline | see company total | Spring 2013 | Connecting from Stark County, Montana to ONEOK & Williston Basin Interstate Pipeline |
| HESS | |||
| *Tioga Gas Plant Expansion | $325 Million | Late 2012/2013 | Increase capacity by 120-150MMcfd, increasing total capacity to 250MMcfd |
| MISTRAL ENERGY | |||
| *Vantage Pipeline | $300 Million | 2013 | 430 Mile Pipeline (80mi in US) bringing ethane from HESS Tioga Plant to Alberta |
| SADDLE BUTTE PIPELINE | |||
| *Grasslands Gathering System | n/a | On-going | 80 mi lateral pipelines, 100 mi trunk lines for Natural Gas, NGLs, and crude oil, located south of Watford City |
| *Little Missouri Plant Expansion | n/a | On-going | Increasing capacity from 25mmscfd to 65mmscfd, produces truckable NGLs, future expansion to ethanol production |
| *Wellhead Processing Units | n/a | On-going | Mobile units capable of producing truckable NGL on well-site using associated gas |
| PLAINS ALL-AMERICAN | |||
| *Ross Gas Plant Expansion | n/a | 2013 | Increase total capacity to 50-75MMcfd |
| WHITING/MDU RESOURCES | |||
| *Robinson Lake Gas Plant Expansion | n/a | 2012 | Increase total capacity by 30MMcfd to 90MMcfd |
| *General investment | $3.7 Billion | 2012-2017 | $3.7 Billion over 5 years to increase oil and gas production in the Bakken |
| ALLIANCE PIPELINE | |||
| *Tioga Lateral Pipeline | $141 Million | Spring 2013 | 79 Miles of Pipeline (106.5MMcfd) to bring gas from Williston Basin to the Alliance Mainline |
| STATOIL | |||
| *Diesel Conversions | n/a | On-going | Converting on-rig diesel engines to bi-fuel systems that can utilize associated gas for powering drilling rigs |
| BLAISE ENERGY | |||
| *On-site Grid Power Generation | $7.4 Million | On-going | Project to prove viability of using natural gas for on-rig electricity and grid power generation |
| AUX SABLE | |||
| *Truck Unloading Facility | n/a | 2012 | Facility at Palermo Gas Plant will accept NGLs including high ethane mixes for entry to Prairie Rose Pipeline |
Figure 8. Map of North Dakota Processing Plants

IV. Understanding Infrastructure Development
Size of Play and Speed of Development
The geographic extent of activity in the Bakken, across state and national borders, must be taken into account when addressing the construction of infrastructure, particularly building natural gas gathering pipelines to connect every single new well. Rapid oil development has been taking place across a 15,000 square mile play since 2006 and it is only now that companies are beginning to hold their acreage by production. Leasing requirements meant that companies had to get wells drilled as quickly as possible to legally hold onto their acreage. Many leases signed at the beginning of the boom (2007-2008) required companies to drill wells and begin production within a short period of time, typically 3-5 years. Companies had to produce oil in order to hold their leases. The necessary infrastructure to capture and sell gas was unable to keep pace with such rapid development. Flaring may have a chance to decline now that many companies are beginning infill drilling (decreases acre spacing per well, adding more wells to an existing field) and holding their acreage by production.
Figures 9 and 10 below illustrate the size of the play. In figure 9, the red dots correspond to every well that began production in 2011. Figure 10 shows all U.S. Bakken wells.
Figure 9. 2011 Bakken Well Activity (U.S.)

Source: HPDI, Includes Three Forks
Figure 10. All Bakken Wells (U.S.)

Source: HPDI, includes Three Forks
Feasibility and Economic Viability of Immediately Getting Gas to Market
Most of these wells will in time be hooked up to gas gathering processing facilities; however, some wells are too far from any other existing wells or gathering facilities for gas to be economically captured. The widespread extent of development and the speed at which wells come online, over 100 wells per month, is important to understanding why every well is not immediately connected to a gathering line.
Valuable Associated Natural Gas Rich in Natural Gas Liquids
Many critics contend that companies are simply flaring associated gas from Bakken wells because relative to oil, gas offers little value to the producer given that Henry Hub natural gas prices are currently below $3 per mcf (thousand cubic feet). The truth is that Bakken gas is very rich in NGLs (natural gas liquids) and offers considerable value to producers and midstream participants.
Dry gas is considered to be lean and mainly methane. It contains about one gallon of NGLs per mcf. Wet gas is rich in NGLs, but the amount (gallons per mcf) varies from play to play. The Bakken is said to produce six to twelve gallons of NGLs per mcf of natural gas, making it one of the richer gas plays in the country. Because of this, the cost of flaring is actually greater in North Dakota’s Bakken than in other plays (see figure 11 below).
Figure 11. Gallons of Natural Gas Liquids per Mcf by Shale Play
| Rich Gas Shales | NGL GPM 1 |
| Avalon/ Bone Springs 2 | 4.0 to 5.0 |
| Bakken 2 | 6.0 to 12.0 |
| Barnett | 2.5 to 3.5 |
| Cana-Woodford | 4.0 to 6.0 |
| Eagle Ford 3 | 4.0 to 9.0 |
| Granite Wash | 4.0 to 6.0 |
| Green River 2 | 3.0 to 5.0 |
| Niobrara 2 | 4.0 to 9.0 |
| Piceance-Uinta | 2.5 to 3.5 |
| Montney | 3.0 to 4.5 |
| Marcellus-Utica 3 | 4.0 to 9.0 |
| 1. GPM = gallons NGLs per mcf | |
| 2. Oil Shale Plays | |
| 3. Oil and Gas Shale Play | |
Source: Veresen, Presentation Bakken Product Markets and Take-Away Denver Jan 31-Feb 1 2012
The NGL stream includes ethane (about 40%), propane (about 30%), butane, iso-butane, and natural gasoline. Figure 12 below indicates the NGL stream in Bakken crude once processed.
Figure 12. Bakken Well NGL Production
| Typical Bakken Well | |||
| BTU | 1,534 | ||
| Mol% | GPM | ||
| Methane | C1 | 51.246 | |
| Nitrogen | N2 | 4.626 | |
| Carbon Dioxide | CO2 | 0.858 | |
| Ethane | C2 | 20.374 | 5.447 |
| Propane | C3 | 13.407 | 3.693 |
| Iso-Butane | Ic4 | 1.443 | 0.472 |
| Normal Butane | nC4 | 5.335 | 1.682 |
| Iso Pentane | iC5 | 0.909 | 0.332 |
| Normal Pentane | nCS | 1.403 | 0.508 |
| Natural Gasoline | C6+ | 0.399 | 0.164 |
| Total | 100 | 12.298 | |

Source: BearTracker Energy, Presentation Bakken Product Markets and Take-Away Denver Jan 31-Feb 1 2012
Associated gas must be processed and separated to remove the different components in the NGL stream. This means building the necessary infrastructure to gather, compress, and process the gas. The value of these NGLs varies according to the market, but can easily add $6 to $12 per barrel of oil if captured and processed. This is a significant incentive to the oil producer considering oil produced in North Dakota suffers a steep price discount due to its distance from major refining centers.
Figure 13 below shows NGL prices in both Conway and Mont Belvieu (two major NGL pricing hubs) for May 2012.
Figure 13. NGL Prices May 2012
| NGL Value in $/MMBtu | Column1 | Column2 | Column3 | Column4 |
| May 2012 | Conway | Change from last month | Mont Belvieu | Change from last month |
| Ethane | 0.56 | -26.79% | 1.70 | -30.41% |
| Propane | 2.00 | -30.72% | 2.70 | -31.72% |
| Normal Butane | 1.43 | -14.86% | 1.52 | -25.41% |
| Isobutane | 0.87 | -25.81% | 0.95 | 25.55% |
| Pentane | 2.49 | -14.39% | 2.48 | -17.65% |
| Total bbl. value in $/MMBtu | 7.35 | -21.92% | 9.35 | -26.50% |
| Margin | 5.01 | -30.55% | 6.98 | -33.35% |
Source: Midstream Business July/August 2012
Natural Gas Transmission and Processing Hurdles
Unlike crude oil which can be transported via rail in tank cars, by truck, or by pipeline, natural gas must be transported via pipeline, sent to a compressor, and then sent to a proper facility to separate the products in the natural gas stream. Associated gas from Bakken wells is rich in NGLs and low in pressure, which means it needs to be compressed at a compressor station in order to be sent to a gas plant for processing. Plant processing construction in North Dakota is currently keeping pace with natural gas production (in terms of volumetric capacity), however, flaring still remains a problem (see figure 6 in Section III).
Figure 14. Process of Transmitting Natural Gas from Wellhead to End User

Source: EPRINC Diagram
Building gathering capabilities is not typically done by the producer, but rather by a third party company and requires designing facilities, receiving the necessary permits and rights of way, acquiring the manpower, aligning the capital investment, and complying with regulatory requirements. While obtaining the necessary permits from the State of North Dakota has largely been a non-issue, obtaining rights of way from landowners has been a rising obstacle. Due to the intense level of oil activity in the Bakken, landowners are experiencing fatigue and companies are experiencing increasing difficulty getting all the landowners along individual pipeline routes to agree to pipeline construction (whether it is for gathering gas or for moving crude). The stickiness between project permitting to the time of construction is causing lags in infrastructure completion and exacerbating natural gas gathering needs (as well as oil gathering needs.) The State of North Dakota has been working with companies and landowners to try and better understand these issues.
Manpower, Housing, and Weather
The oil boom in North Dakota (and the entire Bakken area) is causing infrastructure bottlenecks across several related sectors, including the midstream, housing, and labor. Building new gathering and processing facilities means bringing in new workers and crews. Finding a home for a new employee or crew in North Dakota is a feat in itself. “Mancamps” or company lodging for crews, camper villages, and tents are commonplace in the Bakken. Like natural gas gathering lines, North Dakota housing production has been unable to keep up with rising demand. The housing shortage was exacerbated last summer by flooding from severe rains which destroyed hundreds of newly built homes. The 2011 summer flooding followed a historic winter with significant snowfall and common temperatures below -40 degrees Fahrenheit. While the past winter and spring has been unseasonably mild, North Dakota’s weather is usually an infrastructure impediment in itself. Building natural gas lines or homes becomes difficult or impossible in such severe conditions and may cause delays.
V. North Dakota in Context
The World Bank recently published updated numbers on flaring across the globe. The United States illustrated the highest increase in flaring for the year 2011. And the Word Bank pointed to North Dakota as the primary source for this flaring increase. However, historical data correlated to increases in U.S. production indicates that North Dakota may not be responsible for the majority of this increase. U.S. flaring has had the most significant increase in 2011, but it should be noted that in comparison to the world’s largest flaring country, Russia, the U.S. only flares a small fraction. In 2011 Russia flared over five times as much as the U.S. at 1,321 bcf (billion cubic feet) while the U.S. flared 251 bcf.
Figure 15. World Bank Global Flaring

Source: NOAA Satellite data via World Bank
When discussing flaring in the U.S., the pace of oil development must be taken into consideration. U.S. oil production is well over 6 million barrels per day. Since January 2008 production has grown by over one million barrels per day. Many oilfields such as the Permian Basin have extensive legacy production. However, other plays, such as the Eagle Ford in southern Texas, have had little to no production and therefore have almost no infrastructure to manage the oncoming associated gas. Even the prolific Permian Basin is seeing significant infrastructure constraints as its older facilities are proving inadequate to handle such vast volumes of new oil and gas.
The amount of production growth in such a short period of time is historic and the repeatability of such high well performance is unprecedented. Wells in both the Eagle Ford in Texas and the Bakken in North Dakota often have initial production (IP) rates of 4,000 b/d of oil. They also produce large volumes of associated gas. And while billions of dollars of investment are taking place across the United States to build gathering and processing facilities to capture this natural gas, it does not necessarily mean flaring numbers will rapidly decline overnight. For example, many wells in North Dakota are being connected to gathering lines and processing facilities; however, when a new well comes online that has significant production; previously connected wells may actually need to start flaring again so the gathering pipelines can safely handle the new gas volumes.
Figure 16. U.S. and North Dakota Flaring with U.S. Oil Production

Source: EIA, World Bank, NDIC, NOTE that the 2011 U.S. flaring number is from World Bank satellite flaring data and therefore not venting
Figure 16 above shows U.S. oil production and natural gas flaring/venting since the 1930′s. U.S. flaring/venting peaked in the 1940′s, several decades before U.S. crude oil production peaked. Since then there have been several temporary increases in flaring/venting, notably in the 1960′s as crude oil production was growing towards its peak, but flaring/venting has remained between approximately 100 bcf and 300 bcf per year since the late 1970′s. Flaring/venting actually declined during 1976-1985, a period in which crude oil production grew by almost 1 million barrels per day. The spike in flaring/venting in the mid-1990s corresponds to the same spike in figure 17, “U.S. and Major Flaring and Venting States through 2010″ indicating that flaring/ventingventing in Wyoming lead to this increase.
Figure 17 below indicates that while North Dakota flaring/venting (almost all flaring in ND) has significantly increased, substantial volumes through 2010 are attributable to Texas and Wyoming. Since 2009, Texas oil production has risen by nearly 800,000 barrels per day. This is due to booming oil and liquids rich formations such as the Eagle Ford and Permian Basin.
Figure 17. U.S. and Major Flaring and Venting States through 2010

Source: EIA
Texas is known for having judicious permitting in the oil and gas sector (which should allow for gas gathering infrastructure to help keep pace with oil development); however, with the surge in oil production in recent years, Texas permits for flaring have increased. Texas issued 306 flaring permits in 2010 and 651 permits in 2011.
Figure 18 below shows total U.S. flaring not including North Dakota.
Figure 18. Total U.S. Flaring Without North Dakota

Source: US EIA and ND DMR
VI. Calculations of Lost Economic Value due to Regulations Prohibiting Flaring
While flaring can be inefficient and harmful to the environment, prohibiting the production of crude oil has significant economic costs. A typical 2012 Bakken well has an expected lifespan of 45 years and will produce 615,000 barrels of oil. It creates $20 million in net profit, pays $4 million in taxes, $7 million in royalties, $2 million in wages, and $2 million in operating expenses.
At $80 a barrel a Bakken well would lose $1 million for every year it is shut in. This loss assumes equal production across the 45-year life of the well. Because Bakken wells experience sharp declines during their first few years of production this loss would be significantly higher in the well’s earlier years. Additionally, shutting in a well could result in reservoir damage. Bakken wells produce extremely high initial production rates due to the overpressure inherent in the formation. As a Bakken well is tapped, oil is initially forced to the surface at high pressure and in large volumes, but production declines substantially during the first few years of a well’s life and eventually plateaus at a low level.
Figure 19. Typical Bakken Oil Well Production

Source: NDIC
As oil production declines substantially in the first few years of a well’s life, so does associated gas production. The longer a producer waits to connect an oil well to gas gathering and processing facilities to sell associated gas, the more money it loses. The economic incentive for a producer is to connect a well to gas sales at the very beginning of the production cycle, when gas and oil production is at their highest levels (see appendix for gas decline curves).
Figure 20. Typical Bakken Well Economics: Oil, Gas, and NGLs
| Year | Barrels of Crude Oil Per Year | MCF Per Year of Associated Gas* | Crude Value at $80 WTI | Dry Gas Value at $3/mcf | NGLs Value at $10/mcf | Total Value of Well Per Year (Oil, Dry Gas, and NGLs) |
| 1 | 365,000 | 393,385 | $29,200,000 | $1,181,505 | $3,933,850 | $34,315,355 |
| 2 | 175,200 | 189,041 | $14,016,000 | $567,123 | $1,890,410 | $16,473,533 |
| 3 | 65,700 | 70,890 | $5,256,000 | $212,670 | $708,900 | $6,177,570 |
| 4 | 36,500 | 39,384 | $2,920,000 | $118,152 | $393,840 | $3,431,632 |
| 5 | 29,200 | 31,507 | $2,336,000 | $94,521 | $315,070 | $2,745,591 |
Source: EPRINC Calculations using NDIC data of a typical Bakken well
As figure 20 indicates, the value of the well is mostly in first few years of production. Additionally, figure 20 shows that the value of oil far outweights both dry gas and NGLs with assumed prices of $3/mcf for dry gas and $10/mcf for NGLs.
EPRINC constructed a present value (PV) model to better understand the financial incentives associated with natural gas flaring in North Dakota. These are financial calculations and do not take into account calculations with regard to environmental gains or losses. This model examines the present value implications of banning any new flaring in order to construct sufficient natural gas infrastructure to capture all associated gas. Scenarios were designed around hypothetical regulations prohibiting the flaring of natural gas and therefore prohibiting vast amounts of new oil production. The three scenarios include: No Restrictions on new wells, continued natural gas flaring at a rate of 32% and declines by 2% a year from 2013 to 2017 and 3% a year from 2017-2022 as additional infrastructure is installed; 3 Year delay on new wells, subsequently 100% of natural gas is captured, 0% flaring; and a 5 Year delay on new wells, subsequently 100% of natural gas is captured, 0% flaring. EPRINC’s model holds oil production constant at the current level of 660,000 barrels per day in both the three and five year scenarios. This is based on an estimate that enough new oil production will come online without creating additional flaring, offsetting production declines from existing wells. Continued drilling would be needed to maintain current production levels under the three and five year delay scenarios. This could take place without new flaring as new gathering infrastructure comes online. Some new drilling will occur on developed acreage with existing gas gathering facilities.
Figure 21. Combined Present Value of Oil and Gas Production in North Dakota Under 3 Scenarios (through July 2022)

Source: NDIC current production data, NDPA forecasts, EPRINC calculations, 5% annual discount rate, EIA’s AEO 2012 oil and natural gas prices, $8 of NGLs produced for every mcf of dry gas
Figure 22. Lost Value Due to Flaring Restrictions
| $ Billions | No Restrictions | 3 Year Delay | 5 Year Delay |
| Cumulative PV of Oil, NGLs, and Gas Production | 320 | 284 | 270 |
| Difference vs. No Restriction Scenario | -36 | -50 |
Source: NDIC current production data, NDPA forecasts, EPRINC calculations
Figure 22 breaks down the differences in value between the no restrictions scenario and the 3 year and 5 year delay. With a three year delay in oil production due to regulations prohibiting flaring there is a PV loss of $36 billion. In the five year delay scenario there is a PV loss of $50 billion.
Figure 23 below illustrates crude oil production in the three scenarios (see appendix for gas figure). The cumulative production for scenario 1 with no restrictions is 3,257 million barrels; scenario 2 with a three year delay is 2,946 million barrels; and scenario three with a five year delay is 2,714 million barrels.
Figure 23. North Dakota Oil Production Under 3 Scenarios

Source: NDIC current production data, NDPA forecasts, EPRINC calculations
VII. Alternative Ways to Use the Natural Gas
Oil companies in the Bakken and the State of North Dakota have recently been speaking of the potential to fuel drilling rigs with natural gas. Utilizing natural gas to fuel rigs could provide a dual benefit of reducing natural gas flaring as well as reducing rig fuel costs for the producer. Statoil is currently using multiple bi-fuel rigs which are powered by a combination of diesel and natural gas. Because companies generally use a contractor for their rigs rather than owning them, a conversion to natural gas power may not be a rapid transition. The drilling rig contractor must see the economic benefit in either retrofitting the rig or purchasing new natural gas rigs for their fleet. Additionally, because many rigs use both electricity and diesel for power, natural gas generators on-site may be an efficient way to help power rigs as well as reduce flaring. Blaise Energy’s on-site natural gas generators create electricity that can be used for on-rig electricity as well as being sold back into the grid.
Efforts to support these medium term solutions as well as the investment in gathering and processing offer great promise to reduce flaring in North Dakota. While flaring continues to remain at elevated levels, more new wells are being connected to gathering lines. As acreage becomes held by production and operators begin infill drilling where they have established infrastructure, more new wells will likely be connected to gathering lines immediately. All of these factors taken together suggest that flaring is a short-term problem that can be remedied with near-term solutions and curtailed over the course of the next several years.
APPENDIX
North Dakota Bakken and Three Forks Gas Vintage Type Curve (Decline Rate)

Source: HPDI Aug 27th, 2012
North Dakota Dry Natural Gas Captured Under 3 Scenarios

Source: NDIC current production data, NDPA forecasts, EPRINC calculations