
(For Footnotes Please Download the PDF Version of This Report)
Policy debates over taxes on domestic oil and natural gas operations are a recurring theme in U.S. energy policy, and changes to oil and gas taxes take place at both federal and state levels. The administration is now proposing wide ranging increases to the federal tax treatment of both upstream and downstream operations in the U.S. petroleum industry. The rationale provided for these changes, according to the Treasury Department are: (1) to eliminate the current level of “excessive” investment in domestic oil and gas operations and return the industry to a more neutral tax regime; (2) to reduce carbon emissions and encourage the use of renewable fuels; and (3) to redirect tax “subsidies” from the oil and gas sector to “more productive uses.” EPRINC’s assessment concludes that given the already high cost characteristics of oil and gas production in the United States, the proposed taxes would not achieve Treasury’s objectives and instead would result in higher imports of crude oil and petroleum products and would increase, rather than decrease emissions of greenhouse gasses (GHGs).
The new taxes are proposed across several categories. Taxes on upstream and downstream operations alone seek to raise $31.5 billion over 10 years by “reclaiming” a series of so-called “oil and gas company preferences” that have been granted in previous years. These taxes would repeal the deduction on domestic manufacturing income for the petroleum industry, eliminate expensing of intangible drilling costs, eliminate the percentage depletion allowance for oil and natural gas production, charge new fees on nonproducing federal leases, and possibly make additional adjustments to royalties paid on federal leases. The plan includes a new excise tax, not yet specified, on offshore oil and gas production in the Gulf of Mexico to correct a so- called “contracting mistake” made by Congress. This provision gave royalty relief for deep water operations when oil and gas prices were relatively low, but did not remove the royalty relief for periods when oil and gas prices were relatively high. In many cases, properties that would now be subject to the new tax were bought and sold with the understanding that the royalty and tax provision on the leases would remain as stated in the contracts with the federal government.
In addition to proposed changes in the tax code, the House of Representatives has completed work on a wide ranging legislative initiative to restrict emissions of GHGs, which falls heavily on the domestic refining industry. Against the background of proposed new restrictions on GHGs are growing requirements (and rising costs) of bringing additional supplies of biofuels into the domestic transportation fuels market.
Using existing U.S. government evaluations of the financial cost of imported oil, increased tax revenues forecasted from the removal of upstream production incentives will be offset through lost domestic production as a result of lower investment in domestic exploration and development. Much of the production loss occurs from the accelerated closure of marginal wells, which are particularly reliant on free cash flow to sustain operations, as a result of the repeal of percentage depletion. The tax proposals will also lead to greater emissions of GHGs as domestic natural gas production is curtailed in favor of greater coal use in the generation of electricity – at least in the very near term. Finally, recent reforms in corporate tax treatment to place U.S. manufacturers on a level playing field with foreign manufacturers would be repealed for the petroleum sector only. These new taxes would assist foreign refiners in gaining greater market share of the domestic market. The share of the U.S. gasoline market now claimed by foreign refiners has doubled over the last nine years and likely will continue to grow as refiners face higher costs from the loss of the manufacturers tax credit.
The New Tax Proposals
Table 1 provides a list of the proposed tax code changes as found in the Administration’s FY2010 budget proposal and the average annual cost of the taxes as calculated by EPRINC using the Administration’s year by year estimates.
Table 1. New Tax Initiatives for Domestic Oil and Gas Operations, 2010-2019
| A Selection of Proposed Taxes | Estimated Average Annual Cost, 2010-2019 ($ millions) |
| Reinstate Superfund taxes – Would Impose taxes on oil and chemical products and use revenues to help clean up contaminated sites. | *** |
| Repeal LIFO (Last In – First Out) – Limit the options to account for the flow of inventories for tax. Would require significant amounts to be treated as income. | *** |
| Levy excise tax on Gulf of Mexico oil and gas – Impose an excise or severance tax on oil and gas production from federal offshore leases. | 528.3 |
| Repeal expensing of intangible drilling costs – Eliminate the ability to immediately deduct certain costs associated with drilling and developing wells for tax purposes and instead recover such costs over some period of time. | 334.9 |
| Repeal deduction for tertiary injectants – Eliminate the ability to immediately deduct certain costs associated with tertiary recovery projects for tax purposes and instead recover such costs over some period of time. | 6.2 |
| Repeal passive loss exception for working interests – Would limit the ability for some taxpayers to fully use losses generated from their oil and gas properties against other income. | 4.9 |
| Repeal Sec. 199 for oil and natural gas companies – Would deny taxpayers from claiming a deduction on their domestic oil and gas production and refining activities. | 1329.3 |
| Increase G&G amortization period for independent producers to 7 years – Would require all taxpayers to recover the cost of geologic and geophysical costs over a seven year period in a manner that is similar to how these costs are treated by major integrated oil companies. | 118.9 |
| Repeal percentage depletion for oil and natural gas – This would require all taxpayers to recover their investment in mineral reserves as such reserves are produced rather than by a stated percentage each year. | 825.1 |
| Fee on nonproducing leases (“use or lose”) | 115.6 |
| Total: | 3263.2 |
Sources: General Explanations of the Administration’s Fiscal Year 2010 Revenue Proposals and the proposed FY 2010 budget from OMB. EPRINC has averaged the total cost of the changes, as estimated by the OMB from 2010-2019, over 10 years.
The tax structure for the U.S. oil and gas infrastructure is complex. It treats the operations of so-called independents differently from integrated domestic and international oil and gas companies. For example, the deduction for tertiary injectants, percentage depletion allowances for oil and natural gas production, and the lengthening of the amortization period for geologic and geophysical (G&G) costs are available only to independent producers, not to integrated companies. Repeal of intangible drilling cost expensing will apply both to independents and the majors. But given that independent oil and gas companies drill the majority of the nation’s oil and gas wells, the tax largely falls on smaller companies. These five provisions will add about $1.3 billion per year to the operating costs of independent oil and gas producers between 2010 and 2019 based on the estimates provided by the Treasury Department. Both majors and the independent companies will see additional costs from the excise tax on Gulf of Mexico oil and gas as well as new fees on so-called “nonproducing leases.”
The proposed repeal of LIFO (last in-first out) for evaluating net revenue from inventory will target all U.S. companies, not only the oil and gas industry. Treasury estimates that the total cost to all U.S. companies will be $61 billion from 2010 to 2019. Any company currently holding large legacy product reserves under LIFO that is forced to switch to FIFO (first in-first out) will see a large increase in tax liabilities. Large independent and integrated refiners in particular will likely be affected. EPRINC has not made a calculation on the consequences to oil and gas company operations resulting from moving to FIFO from LIFO.
It does not appear that Treasury has attempted to evaluate potential production losses from the new tax structure. The U.S. is a mature petroleum province and much of the domestic crude oil resource is relatively costly to produce. A large volume of domestic oil and gas production comes from independent companies. Smaller independents typically have limited access to borrowed funds – and rely on internally generated free cash flow to finance drilling and production investment. Independent producers account for approximately 68 percent of U.S. crude oil production and 82 percent of U.S. natural gas production. This amounts to 3.4 million barrels per day (mbd) of crude oil and 17.6 trillion cubic feet (tcf) of annual marketed natural gas production. Certain provisions in the tax code, such as the percentage depletion credit, top out at 1,000 barrels of oil or oil equivalent (boe) per day. After daily production reaches 1,000 boe a company may not use percentage depletion on its remaining production.
Section 199 is a provision in the U.S. tax code that was passed to ensure that U.S. manufacturers face a level playing field when competing with foreign firms. This provision in U.S. law was originally intended to reduce the U.S. corporate rate to bring U.S. manufacturers closer to the tax treatment of their foreign competitors. Although the most effective method to achieve this goal would have been to just lower the U.S. corporate tax rate, Congress chose to achieve this goal through provisions that provided extra tax deductions for enterprises engaged in manufacturing. In the U.S. petroleum industry, Section 199 is used by oil and gas producers and petroleum refiners to reduce their tax burden. Note that Treasury’s proposal seeks to eliminate this provision for U.S. manufacturers of petroleum products and oil and gas producers, but not for the production of any other goods in the domestic economy.
Has Treasury Confused Production with Consumption?
In the Green Book, Treasury states that the current tax code encourages excessive investment in the production of oil and gas and is therefore “detrimental to long-term energy security” and “inconsistent with the Administration’s policy of reducing carbon and encouraging the use of renewable energy sources through a cap-and-trade program.”
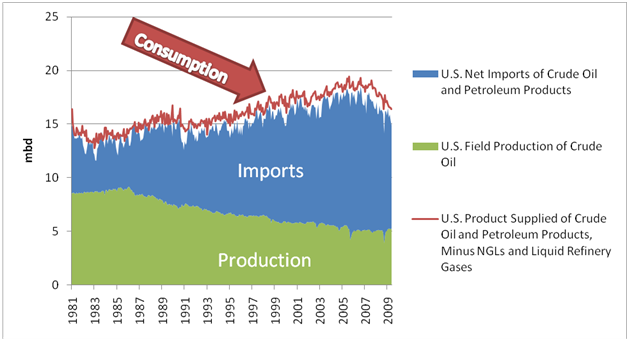
The current tax code, when compared to the Treasury proposal, does indeed encourage domestic oil and gas production, particularly exploration. Here the important question is how much will movement to the new tax regime reduce domestic production? Given that the U.S. is and will remain a large importer of crude oil and petroleum products, shifts in domestic output will be compensated by higher or lower levels of imports. As a result, domestic output of oil and gas is likely to be either neutral or slightly positive with regard to loadings of GHG emissions – domestic production does not require transportation across long ocean voyages. An additional concern is that the level of U.S. petroleum imports will rise in response to any loss in domestic output. Figure 1 below shows that the U.S. currently imports approximately 10 mbd of crude oil and petroleum products . U.S. policy has historically viewed this high volume of imports as harmful to energy security.
Figure 1. U.S. Crude Oil Production, Consumption, and Imports
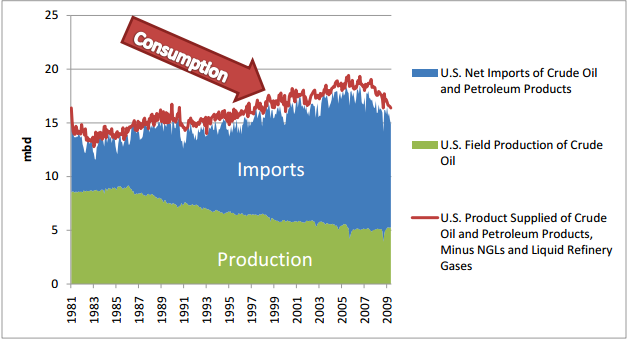
Source: EIA Data, EPRINC Calculation. NGLs are not included in any of these data sets.
Oak Ridge National Laboratory (ORNL) released a study in 2006 that estimated the cost to the U.S. economy of every barrel of imported oil. ORNL found that the cost of imported oil to the U.S. economy is $13.58/bbl (in 2004 $) in addition to the market price. This cost includes both a monopsony component, which is the estimated effect that the U.S has on world oil prices as the world’s largest consumer of crude oil and a cost for macroeconomic disruptions to the U.S. economy. ORNL’s calculations do not include environmental or foreign policy costs. ORNL’s study has been used by National Highway Transportation Safety Administration (NHTSA) to provide justification for increasing corporate average fuel economy (CAFE) standards and by EPA to promote the National Renewable Fuel Standards Program (RFS2).
In 2009 dollars, the incremental benefit of reducing oil imports by 1 barrel is worth $14.70. With petroleum imports for 2009 likely to average approximately 10-12 mbd, the total economic cost to the U.S. economy for the year will be $54-64 billion, about 20 times greater than the amount the administration seeks to raise annually through the elimination of production incentives and Section 199 for oil and gas companies.
Regarding the next 10-20 years, the likelihood of transitioning into an environment of much lower petroleum imports is low. As a result, it is difficult to identify a scenario under which lower domestic oil production will not lead to higher imports. In its 2009 Annual Energy Outlook (AEO 2009), EIA projected U.S. liquid fuels consumption at 20.2 mbd in 2020 and 21.7 mbd in 2030. If the Energy Independence and Security Act of 2007 (EISA 2007) is met in 2022, it will contribute just 2.35 mbd of renewable transportation fuels. The remainder of projected U.S. liquid fuels consumption will presumably be supplied by domestic crude oil production (currently 5 mbd) and crude oil imports.
Figure 2 below shows the projected net import share of U.S. liquid fuels consumption from EIA’s 2009 Annual Energy Outlook. Even in the high oil price scenario the U.S. will be importing about one third of its liquid fuel needs from 2020 through 2030, equivalent to about 7 mbd. In the reference case imports will account for 40-45% of liquid fuels consumption and in the low price scenario imports will be relied upon to cover over half of the country’s liquid fuels consumption.
Figure 2. Net Import Share of U.S. Liquid Fuels Consumption in Three Cases (1990-2030)
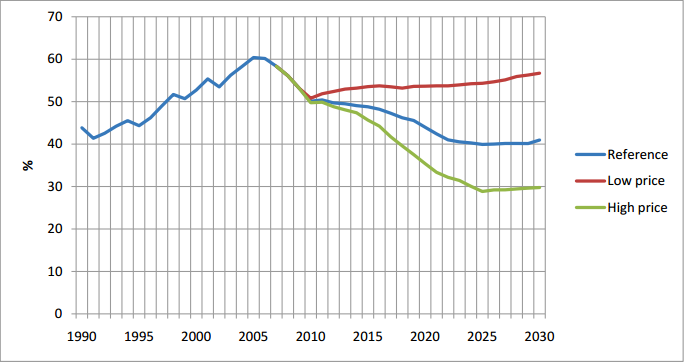
Source: EIA 2009 Annual Energy Outlook.
Role of Free Cash Flow in Domestic Petroleum Investment
A wide range of variables affect decision making on whether to proceed with exploration in domestic oil and gas provinces, including the price of oil and natural gas, technology and drilling costs, geology, environmental regulations, access, local taxes, and federal tax treatment. Independent and integrated firms are treated differently in the federal tax code. However, by segmenting the industry by size of operations we can make a rough estimate of the potential reduction of E&P activity as well as the likely acceleration in abandonment of marginal wells. These are the high cost operations that are most susceptible to shifts in tax treatment.
Free cash flow from existing operations represents the primary source of funding to maintain existing production and also to explore and develop new prospects. Companies large and small have historically reinvested 100%, if not more, of their free cash flow (roughly equivalent to net income after-taxes, plus depletion, depreciation, and amortization (DD&A)), into the development of current and future projects. Figure 3 shows the correlation of free cash flow and investment in exploration and development (E&D) from 1977-2007. The data in Figure 3 is for cash flow and net income from U.S. oil and gas production only and for E&D investment in the U.S. only. In addition, this data generally misses the smaller producers since companies who report to EIA’s Financial Reporting System (FRS) are publicly traded and tend to be either large integrated or large independent companies.
Figure 3. Free Cash Flow and E&D Spending for FRS Companies (after tax)
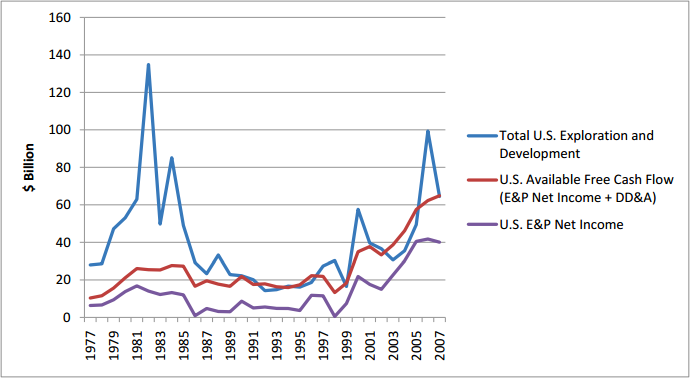
Source: EIA Data, EPRINC Calculations
As a result of relatively low oil and gas prices during the past few quarters, producers have seen their income decline significantly. Although FRS oil and gas producers have subsequently reduced capital investment in domestic operations, capital investment has remained strong relative to the drop in income. Figure 4 shows income for U.S. oil and gas production and capital investment in U.S. oil and gas production for recent quarters. It is not necessary identical to the data sets used in Figure 3 but is a reasonable representation of recent trends in income and investment.
Figure 4. Domestic Oil and Gas Production Income and Capital Spending for Recent Quarters (pre-tax)
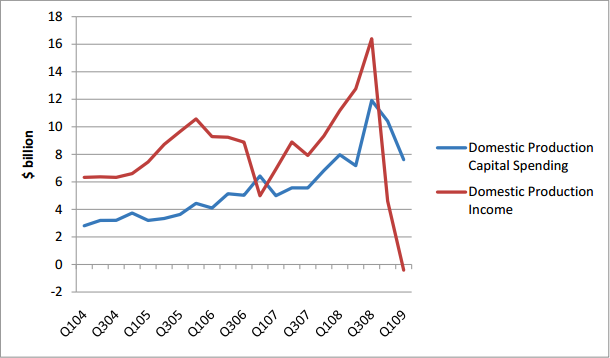
Source: EIA Data
Given that the new tax proposals will reduce free cash flow it is likely that we will see a corresponding reduction in E&D expenditures. E&D expenditures include exploration and surveys, lease acquisitions, and drilling, among others activities. Should the Treasury tax proposals be enacted, we can expect that large companies will reduce domestic E&D spending by around 3% in the long term as a result of the taxes on upstream production alone.
Percentage Depletion and Marginal Wells
The role of independent oil and gas producers in the United States has increased dramatically over the last twenty years. Many of the smaller firms tend to be poorly capitalized and risk capital often comes from private placements and more importantly, from cash flow from existing operations. In addition, EIA data (2006) show that 15% of total domestic production is spread out among 10,000 small producers; each of whom produce less than 1,000 boe of oil and gas. For these companies, cash flow from existing operations is crucial to keeping high cost operations running.
Approximately 82% of U.S. crude oil production comes from just 17% of U.S. wells. The remaining 18% of U.S. crude oil production (83% of producing wells) comes from the highest cost producing segment of the industry. Virtually all of this production comes from small independent producers, many who are producing from so-called marginal wells (or stripper wells) with output less than 10 or 15 bbl/day. These wells are the most costly in the U.S. production system and produce about 915,000 bbl/d, an average of only 2.2 bbl/d per well in 2006.
Figure 5. Stripper Well Production
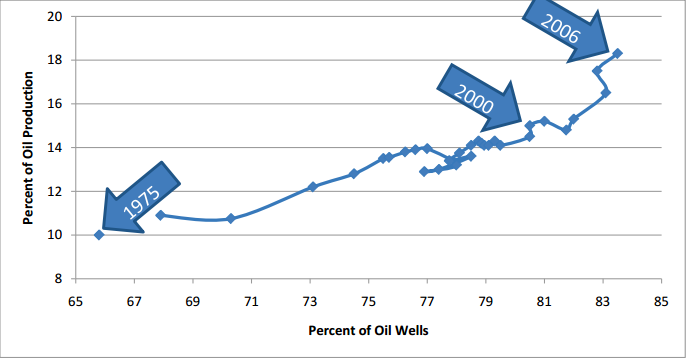
Source: EIA Data, http://www.eia.doe.gov/pub/oil_gas/petrosystem/us-3o.html
According to DOE over 177,000 marginal crude oil wells were “abandoned and plugged” from 1994 through 2006, a closure rate of 3% of wells per year. They were closed not necessarily because they ran out of oil, but because they became unprofitable. Due to their high operating costs, marginal wells are particularly dependent on cash flow, and are more vulnerable to closure when prices are low. Percentage depletion enables producers to take a tax deduction based on the well’s gross income. This deduction contributes to free cash flow, allowing marginal operators to reinvest in the maintenance of their well and expansion of their operations.
For this segment of the industry there are two aspects to estimating possible loss of production from the higher taxes. First, an accelerated rate of abandonment of existing production from high cost operations. Second, high cost-low production wells not defined as marginal will become marginal at a faster rate and experience an increase in the rate of well abandonment as compared to the current tax regime. Note also that when marginal wells are shut it is extremely rare for them to be reopened—once shut in the production is lost forever.
The only way to obtain a precise estimate of lost production from the new tax regime would be to sample a large number of existing oil and gas plays, and examine their profitability under a discounted cash flow model using the new tax regime. Note, however, that the losses need not be large for the Treasury to reach the point where the revenue gain from the higher taxes is cancelled by the economic costs of the lost production. At the point where U.S. production losses exceed 160,000 bbl/d the U.S. economy will experience a financial loss that exceeds the revenue growth to the U.S. Treasury. This is because the resulting increase in oil imports (using ORNL’s $14.70/bbl cost to the economy from imports) quickly cancels out the increased taxes paid to the federal government. This estimate does not include the lost revenue to the Treasury, states, and localities from the lost domestic output. Note that the breakeven point is reached as early as 2011 if the decline rate reaches an annual rate of 13 percent and 2014 at an annual decline rate of 4 percent, as opposed to a historical baseline decline rate of 3 percent annually.
Figure 6. Lost Production Breakeven Points for Repeal of Percentage Depletion: Where Increased Revenue to Treasury = Financial Loss to U.S. Economy from Higher Crude Oil Imports, 2010 – 2020
(Assumes Marginal Oil Well Production at 920,000 bbl/d in 2010)
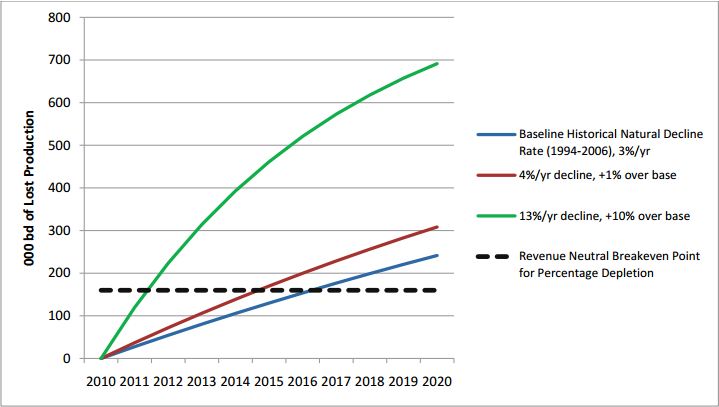
Source: EPRINC calculations. Marginal oil wells tend to decline at about 3 percent per year. The loss in the depletion allowance will likely increase this rate of decline to anywhere from 4 to 13 percent per year. Natural gas production, which has experienced very low prices as gas values, at least for the near term have decoupled from crude oil, is probably even more at risk.
Domestic Natural Gas Outlook
Over the last 20 years the continental U.S. has been subject to an active exploration effort to extend discoveries of natural gas. Natural gas can make an important contribution to lowering GHG emissions both in the near and longer term. The recent surge in U.S. natural gas production, largely a result of shale plays long considered unconventional and uneconomic, are now viewed as a conventional resource. Figure 7 shows the steep increase in marketed domestic natural gas production, largely from the surge in shale gas output.
Figure 7. Marketed Monthly U.S. Natural Gas Production
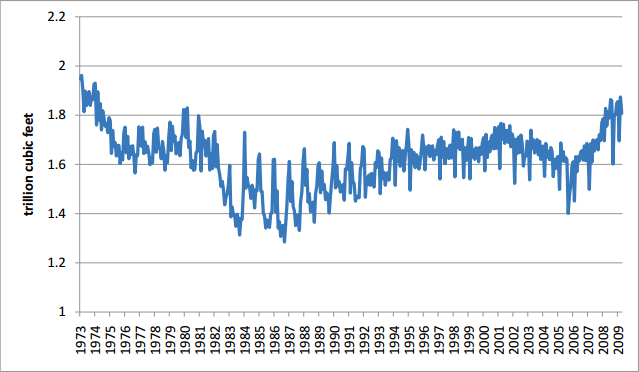
Source: EIA Data
After natural gas production stagnated during the 1990′s and began to decline in the early 2000′s, several technological developments allowed gas producers to unlock the country’s shale resources, which previously were not included in the resource base. Dry natural gas proven reserves have increased from 177 trillion cubic feet (tcf) in 2000 to 237 tcf in 2007. The bulk of this increase can be attributed to shale gas and other low permeability formations. It is likely that 2008 data – when available at the end of 2009 – will show even greater growth.
The recent surge in natural gas production and storage build-up, in combination with excess global liquefied natural gas (LNG) and lower industrial demand as a result of the recession, have helped to keep U.S. natural gas prices remarkably low. Natural gas prices remained relatively flat during the post- March 6 stock market rebound and crude oil rally in which crude oil prices nearly doubled between February and June 2009.
Natural Gas as a Means to Reduce CO2 Emissions
As shown in Figure 8 recent trends in oil and natural gas prices show a return to decoupling in the ratio of oil and gas prices prevalent through much of 2007 and 2008. Although EPRINC has work underway to evaluate whether this trend is likely to persist over the longer term, it raises the obvious question: What is the potential for natural gas compete directly with coal given the emergence of the larger resource base in the U.S.?
Figure 8. Recent Trends in Coal, Oil, and Natural Gas Prices
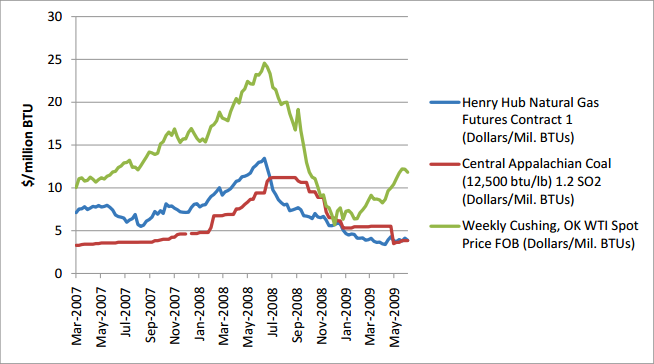
Source: EIA Data, EPRINC Calculation
At least for recent months, plentiful supplies and low prices have made natural gas an attractive alternative to coal. Contrary to Treasury’s assertion, increased natural gas output can, and is, contributing to a reduction in CO2 emissions. Natural gas used for electricity generation emits about 37% less CO2 per kilowatt hour (kWh) than coal fired electricity generation.
Table 3 captures recent changes in U.S. electricity generation by fuel source. Natural gas use in electricity generation increased during the first 3 months of 2009 while coal use plummeted. Electricity production typically declines from January through March. But it tends to decrease across nearly all generation sources, including both coal and gas. As Table 3 shows, in 2009 electricity generation by natural gas actually increased in March over January levels whereas coal generation decreased substantially. The only other source to increase generation was “other renewables”, which generated about 1,000 additional MWhs in March compared to roughly 2,500 additional MWhs for natural gas. In both 2008 and 2007 natural gas generation declined January to March, years in which natural gas prices were higher than coal prices.
Table 3. U.S. Electricity Generation by Fuel Source (MWh)
| Coal | Natural Gas | Nuclear | Hydroelectric Conventional | Other Renewables | Total* | |
| 1995 | 1,709,426 | 496,058 | 673,402 | 310,833 | 73,965 | 3,353,487 |
| 2008 | 1,994,385 | 876,948 | 806,182 | 248,085 | 123,603 | 4,110,259 |
| % Change | 16.67% | 76.78% | 19.72% | -20.19% | 67.11% | 22.57% |
| 2005 | 2,012,873 | 760,960 | 781,986 | 270,321 | 87,329 | 4,055,423 |
| 2008 | 1,994,385 | 876,948 | 806,182 | 248,085 | 123,603 | 4,110,259 |
| % Change | -0.92% | 15.24% | 3.09% | -8.23% | 41.54% | 1.35% |
| Jan-09 | 172,924 | 65,474 | 73,479 | 23,476 | 11,189 | 353,690 |
| Mar-09 | 136,625 | 68,084 | 66,920 | 21,394 | 12,260 | 310,024 |
| % Change | -20.99% | 3.99% | -8.93% | -8.87% | 9.57% | -12.35% |
| All Figures are Thousand Megawatthours except % change | ||||||
| Source: http://www.eia.doe.gov/cneaf/electricity/epm/table1_1.html and EPRINC Calculations | ||||||
| * Total also includes Petroleum Coke, Petroleum Liquids, Other Gases, Hydroelectric Pumped Storage, and Other, which are not displayed on this table. | ||||||
Have We Over Invested in Domestic Oil and Gas Output?
Subsidies for energy production in the domestic economy are the result of a complex set of political and policy considerations. About all EPRINC can conclude from the distribution of these subsidies is that the U.S. remains a long way from a neutral system. For the most part, financial incentives in the energy sector encourage the use of alternative fuels as both a strategy to reduce GHGs and petroleum imports. Tax treatment for domestic oil and gas production has also has certain features to encourage domestic exploration and development.
Table 4 presents data from an EIA estimate of energy subsidies not related to electricity production for 2007. Note that one of the principal reasons for the aggressive federal program to support biofuels was its contribution to reducing petroleum imports and its lower level of GHG emissions.
Table 4. Energy Subsidies Not Related to Electricity Production, 2007
| Category | Fuel Consumption (Quadrillion BTU) | FY 2007 Subsidy and Support (million 2007 dollars) | FY 2007 Subsidy per Million BTU ($/Million BTU) |
| Coal | 1.93 | 78 | 0.04 |
| Refined Coal | 0.16 | 214 | 1.35 |
| Natural Gas and Petroleum Liquids | 55.78 | 1921 | 0.03 |
| Ethanol/Biofuels | 0.57 | 3249 | 5.72 |
| Geothermal | 0.04 | 1 | 0.02 |
| Solar | 0.07 | 360 | 2.82 |
| Other Renewables | 2.5 | 184 | 0.14 |
| Hydrogen | * | 230 | NM |
| Total Fuel Specific | 60.95 | 6237 | 0.1 |
| Total Non-Fuel Specific | NM | 3597 | NM |
| Total End-Use and Non-Electricity | NM | 9834 | NM |
| Source: EIA Data |
EIA’s study was limited to “subsidies provided by the Federal government, those that are energy-specific, and those that provide a financial benefit with an identifiable budget impact.” This includes direct expenditures such as direct payments or grants to energy producers or consumers, tax expenditures that lower the tax liability for companies or individuals who take specified actions “deemed to be in the public interest,” federal research and development, and electricity programs that serve certain customers in certain regions, such as the TVA.
As of 2007 the majority of energy subsidies not devoted to electricity generation were devoted to biofuels, in particular ethanol. In 2009 the Volumetric Ethanol Excise Tax Credit (VEETC), commonly referred to as the blender’s credit, will cost about $4.73 billion minus any blending credits carried over from 2008. The VEETC is considered a tax expenditure. As shown in Table 4, natural gas and petroleum liquids received the fewest subsides per BTU of any energy source. The one exception was geothermal energy which received the lowest subsidy. In absolute terms natural gas and petroleum liquids receive about 40% less support than biofuels, though they provide about 100 times the amount of energy. Similar subsidies are common in the generation of electricity. Solar, wind, and refined coal each received support over $23 per megawatt hour (MWh), while natural gas and petroleum liquids received $0.25 per MWh. In absolute terms natural gas and petroleum liquids received less support than coal, refined coal, nuclear, and wind. From a direct revenue perspective, the oil and gas industry remains the largest energy revenue source to federal and state governments generating approximately $22.6 billion in 2008 royalties and bonus bid payments. With regard to corporate income taxes, the effective tax rate of integrated oil and gas companies has exceeded that of all other sectors in the U.S. economy.
Producing Refined Products
The IRS considers crude oil refining to be eligible for the Section 199 domestic activities production deduction. Beginning in 2005, eligible producers and manufacturers have been able to take a deduction on taxable income earned from qualified activities. According to Grant Thornton LLP the following activities qualify for a Section 199 deduction: “the manufacture, production, growth or extraction of tangible personal property, computer software or sound recordings or qualified films.” Other qualified activities include production of electricity, natural gas, and potable water as well as certain construction services. The Administration seeks to remove Section 199 only for the oil and gas industry.
Crude oil refining is a manufacturing process similar to most others: it turns a raw material into a valuable product. Domestic refining operations have become increasingly vulnerable to foreign competition, particularly from Europe, but growing imports from Asia and the Middle East are also making inroads into the U.S. market. In the competitive dynamic of the U.S. gasoline market, competition from foreign refiners plays a central role in price determination and imports of refined products are well entrenched in domestic product markets. For example, the U.S. imports approximately 1 mbd of gasoline components, much of it from European refiners whose market for gasoline has been shrinking due to Europe’s dieselization of passenger cars.
Foreign competition is one of several forces driving down utilization efficiencies and the rate of return at U.S. refining facilities. Refinery operating rates have been declining since 2005, when refineries last operated at above 90% utilization for an entire year. The trend in refinery utilization is shown in Figure 9 below. Capacity utilization has fallen from 90.5% in 2005 to 82.3% for the first five months of 2009. These reductions is capacity utilization translate into lower margins and reduced rates of return.
Figure 9. U.S. Refinery Operable Capacity and Utilization Rates
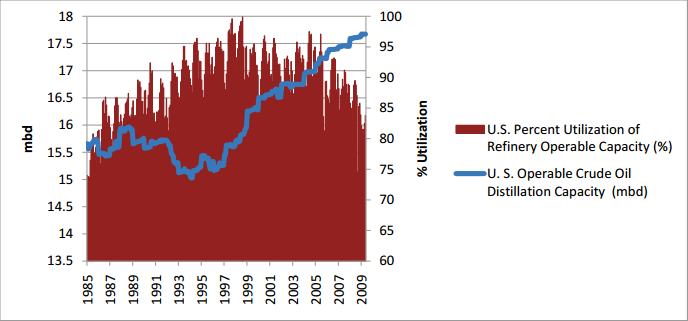
Source: EIA Data, EPRINC Calculations
Figure 10 shows recent trends in margins for the refinery industry’s four main products: Gasoline, jet fuel, distillates and residual fuel. Approximately 85% of refinery output is accounted for by these four products. As shown in the Figure 10, the industry experienced positive margins from 1997 to 2004 and operated at relatively high utilization rates. The years 2005, 2006, and 2007 are sometimes considered to be a “golden age of refining,” albeit a brief age. During this golden age consumption rose along with product prices, creating three years of record margins. Two thousand and eight marked the end of that age and 2009 has ushered in the lowest margins in several years along with refining capacity utilization that is at its lowest since the early 1990′s.
Figure 10. Refiner Margins
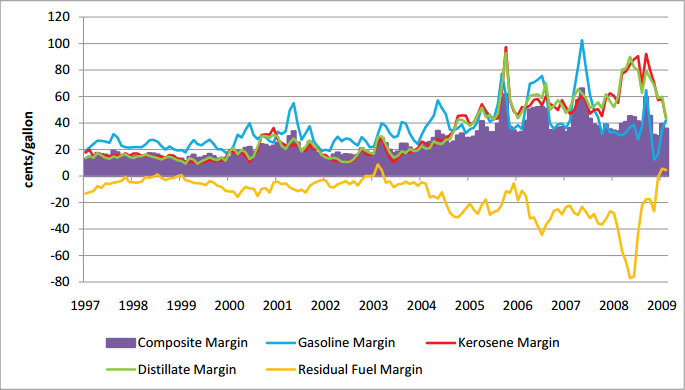
Source: EIA Data, EPRINC Calculations
Foreign refiners are so entrenched in the domestic gasoline market that they are directly linked in a competitive battle for a share of the U.S. products market in which relatively small shifts in cost advantage can bring about large changes in product flows. Figure 11 shows that U.S. gasoline consumption has remained relatively flat during the 2000-2009 timeframe, fluctuating from 8.5 mbd in 2000 to a peak of 9.3 mbd in 2007 (on an annual basis), yet the share of imports in the U.S. gasoline market have consistently increased over this time period. During times of consumption growth, 2000-2007, and consumption decline, 2008-2009, import market share increased. Through the first five months of 2009 imports have accounted for 7-10% of U.S. gasoline consumption.
Figure 11. U.S. Gasoline Consumption and Imports’ Market Share Since 2000
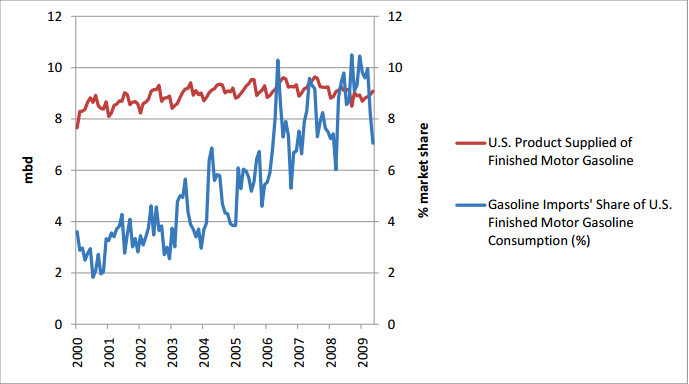
Source: EIA Data, EPRINC Calculations
Concluding Remarks
U.S. taxes collected from the domestic petroleum industry represent a complex and often contradictory patchwork of policy initiatives, trading off concerns over raising revenues with attempts to encourage the development of clean fuels as well as reducing oil and gas imports. The largest drawback of the Treasury tax proposals is that they tend to push U.S. energy policy towards greater reliance on imported oil and natural gas and greater reliance on imported refined products. These tax initiatives cannot be implemented in a vacuum and markets will adjust to the new tax program, largely by substituting imports for domestic production of crude oil and petroleum products.
Although promotion of alternative fuels offers the potential to make some improvements in reducing oil imports and reducing GHGs, there are a broad range of outcomes where the current tax initiatives will both contribute to rising emissions of GHGs and promote rising petroleum imports. There is no scenario over the next twenty years where loss of domestic production will not lead to rising petroleum imports, whether crude oil or refined products. Both alternative fuels and domestic production can contribute to lower imports and reduced emissions of GHGs. This is of particular concern for natural gas which has seen a renaissance in the resource base largely driven through a long-term and active exploration program – partially enabled by a tax code that encouraged such exploration.
In addition to the potential of the tax initiatives to encourage higher volumes of petroleum imports, Treasury’s tax initiatives fail to distinguish between the treatment of extractive operations, such as the production of oil and gas, and manufacturing, such as the processing of crude oil to produce petroleum products. U.S. refiners, whether part of integrated companies or independent enterprises, operate in a competitive environment largely free of “economic rent.” The price of feedstock to U.S. refiners is set in the world market and whether feedstock, i.e., crude oil, prices are high or low, long term data shows no unique correlation between feedstock prices and refiner margins. U.S. refiners operate as manufacturing facilities and face the same cost pressures as other U.S. manufacturing enterprises.