Skip to content
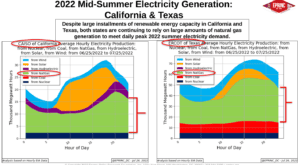 ChartMid-Summer Electricity Generation: California & TexasDespite large installments of renewable energy capacity in California and Texas, both states continue to rely on substantial natural gas generation to…
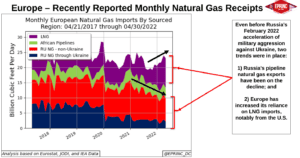 ChartEurope – Recently Reported Monthly Natural Gas ReceiptsEuropean natural gas supply patterns reflect two trends that preceded Russia's February 2022 escalation of military aggression against Ukraine: a decline in…
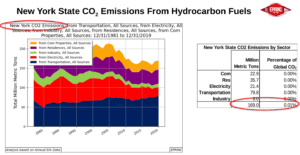 ChartNew York State CO2 Emissions From Hydrocarbon FuelsNew York State's CO2 emissions from hydrocarbon fuels are presented across fuel types, illustrating the state's emissions profile from petroleum, natural gas,…
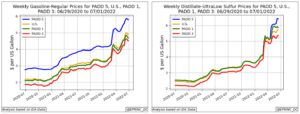 Chart2022 Mid-Summer Retail Transportation Fuel PricesThis EPRINC Chart of the Week examines retail transportation fuel prices as of mid-summer 2022.
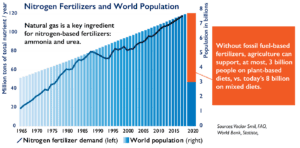 ChartRevised: Natural Gas and Global Food ProductionNatural gas serves as a critical input to global food production, underscoring the linkage between energy supply and agricultural output.
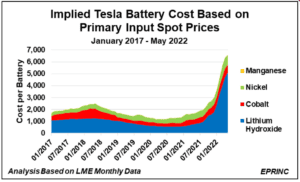 ChartImplied Tesla Battery Production CostsEstimates of Tesla's implied battery production costs indicate the cost trajectory associated with the company's electric vehicle manufacturing.
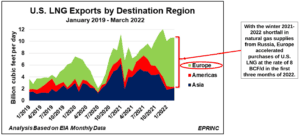 ChartU.S. LNG Exports: Recent TrendsWith the winter 2021–2022 shortfall in natural gas supplies from Russia, Europe accelerated purchases of U.S. LNG at a rate of 8…
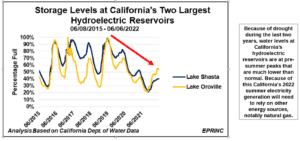 ChartCalifornia Summer Hydroelectric Power Shortfall is ProjectedFollowing two years of drought, water levels at California's principal hydroelectric reservoirs are entering the summer at pre-peak levels well below normal.…
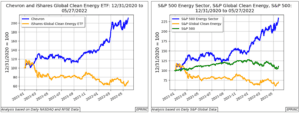 ChartNear- and Short-Term Financial Returns of Green and Legacy Energy Investments vs Key S&P BenchmarksOver the near- and short-term periods examined, legacy energy investments outperformed green energy investments when measured against key S&P benchmarks.
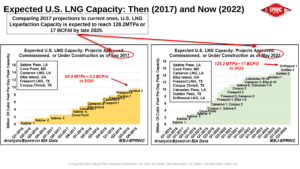 ChartComparing Freeport LNG Contribution Expected U.S. LNG Capacity: Then (2017) and Now (2022)Comparing 2017 projections to current ones, U.S. LNG liquefaction capacity is expected to reach 128.2 MTPa, or 17 BCF/d, by late 2025.