The program resembles an initiative undertaken by the Unocal Corporation in the early 1990s to remove older autos from the market in an effort to find a lower cost approach to meet local air pollution standards.
Whether or not this program will stimulate auto sales is debatable and not the focus of this paper. Instead, this paper examines the program’s impact on U.S. gasoline consumption and tailpipe emissions. While the program may stimulate auto sales, the benefits in reduced demand for gasoline and total loadings of emissions from the tail pipe are minimal.
The “cash for guzzlers” program provides vouchers towards the purchase of a new vehicle if a consumer trades in an older car. A consumer will qualify for a voucher if they turn in a vehicle that achieves less than 18 mpg and replace it with a new car that is at least 4 mpg more efficient. An improvement of 4 mpg yields a voucher worth $3,500 and an improvement of 10 mpg yields a voucher worth $4,500. Under the proposed program consumers may also purchase a SUV or light truck. The new light truck or SUV vehicle must be 2 mpg more efficient in order to earn a $3,500 voucher or 5 mpg more efficient to earn $4,500 voucher. The program seeks to replace one million vehicles and will remain in place for one year.
(for footnotes and references please download the PDF version of this report)
How Much Gasoline Will Be Saved?
It is important to remember that there are over 240 million vehicles on U.S. roads. As result, any program that accelerates the introduction of 1 million vehicles into the U.S. fleet will not substantially shift either total gasoline consumption or total emissions from mobile sources. The most optimistic scenario would bring about the removal of 1 million vehicles with an efficiency of less than 18 mpg with new vehicles offering an improvement in operating efficiency 10 mpg higher than the traded in vehicle. Under this scenario, if one million vehicles achieving 18 mpg were replaced with vehicles achieving 28 mpg, U.S. gasoline consumption would decline, at most, by 15,500 barrels per day (bbl/d), representing 0.17% of consumption at 2008 levels. In this highly optimistic case the program cost would be approximately $2.36 for each gallon saved over an 8 year period, though realistically the program would likely cost closer to $3.00 or more per gallon. Table 1 below shows breakdown in fuel savings and costs per gallon for several combinations of the program.
Table 1. Cost and Effectiveness of Cash for Guzzlers Program
| Baseline=18 mpg, 12,000 VMT | Voucher Value | Program Cost for One Million Vehicles | Gallons Saved Per Vehicle, Annually | Total Fuel Savings for One Million Vehicles Over Eight Years, Gallons | Cost Per Gallon Saved Over Eight Years | Fleet Fuel Consumption Reduction Compared to 2008 Rate |
| New Car, +4 MPG |
$3,500 |
$3,500,000,000 |
121.2 |
969,600,000 |
$3.61 |
0.0882% |
| New Car, +10 MPG |
$4,500 |
$4,500,000,000 |
238.1 |
1,904,800,000 |
$2.36 |
0.1733% |
| New Light Truck/SUV, +2 MPG |
$3,500 |
$3,500,000,000 |
66.7 |
533,600,000 |
$6.56 |
0.0485% |
| New Light Truck/SUV, +5 MPG |
$4,500 |
$4,500,000,000 |
144.9 |
1,159,200,000 |
$3.88 |
0.1054% |
| Sources: EIA Data, EPA Data, EPRINC Calculations | ||||||
Note: These calculations assume the program successfully replaces one million qualified vehicles, which would not have otherwise been purchased, during the program’s one year window; this should not necessarily be considered an achievable goal. It also assumes that the new car is driven the same number of miles (12,000 annually) as the guzzler it replaces and that the guzzlers are removed from the fleet – a highly optimistic assumption.
If the optimistic targets in the program were met the cost to the government for the resulting reduction in crude oil imports would be approximately $100/bbl, roughly twice the current refiner acquisition cost for crude oil. However, the improved efficiency of the fleet would generate proportionally lower loadings of CO2. The value of the reduced loadings of CO2, if we use EPA’s projected carbon price of $13-$17/ton in 2015, generate carbon benefits in the range of $4.80-$6.28/barrel from the expected reduction in gasoline consumption.
Note, however, that if the sole purpose of the voucher program is to reduce carbon loadings, its cost would be approximately $270 per ton of CO2 reduced. This would, of course, not include any of the carbon produced as a result of a net addition of autos to the U.S. fleet.
How Much Will Tailpipe Emissions Be Reduced?
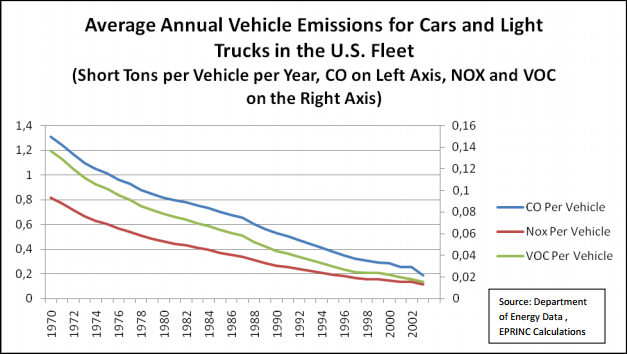
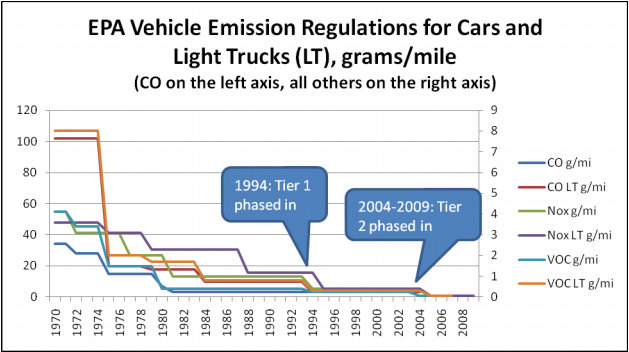
There were 243 million active cars and trucks in the U.S. as of 2006, and for the most part, newer vehicles are driven more than older vehicles. By 2005 the average vehicle (cars and light trucks) in the U.S. auto fleet released roughly 60% fewer regulated emissions than the average vehicle on the road in 1990, and 75% less than the average vehicle on the road 1980. The average vehicle in the 2005 fleet emitted 65% less carbon monoxide (CO), 57% fewer nitrous oxides (NOx), and 65% fewer volatile organic compounds (VOC) than the average vehicle in the 1990 fleet. These reductions are in large part due to ever tightening EPA regulations that restrict emissions for each vehicle, which is not the case for Corporate Average Fuel Economy (CAFE) standards which allow averaging across the entire fleet from a given manufacturer. Nevertheless, the “cash for guzzlers” program is unlikely to have a major effect on total loadings given the size of the U.S. fleet.
Figure 1. Emissions Released Per Gasoline Vehicle by Year
Figure 1 refers to the average of all cars and light trucks/SUVs on the road in a given year, and not the vehicle of a given model year. Therefore, while Figure 1 accurately represents the emissions of the average vehicle on the road in a given year, it is a lagging indicator of the emissions profile of a new car built that year. As Figure 1 demonstrates, the fleet becomes cleaner each year as new cars are added and old ones removed, but it does not reflect the cleanliness of a brand new car relative to an older car. Even though the mean age of cars in the fleet has increased to 9.2 years in 2007 from 6 years in 1980 and the fleet has historically grown by several million vehicles per year, the fleet has continued to show improvements in tailpipe emissions nearly every year since 1970.
Figure 2. EPA Vehicle Emission Regulations Since 1970
Table 2 shows how EPA emission regulations for cars built in 2007 compare to regulations in place in 1990 and 1980. Aside from 1990 CO levels, maximum emission levels were reduced in all categories by over 50%.
Table 2. EPA Emission Regulations in 2007 Compared to 1990 and 1980.
| 2007 g/mi permitted | Reduction below
1990 Regulations |
Reduction below
1980 Regulations |
| CO |
0% |
-51% |
| CO LT |
-66% |
-81% |
| Nox |
-93% |
-97% |
| Nox LT |
-94% |
-97% |
| VOC |
-83% |
-83% |
Car for car, tailpipe emissions have been greatly reduced over the past 30 years, certainly to a greater extent than improvements in fuel efficiency have occurred. However, the size of the U.S. auto fleet dwarfs emission reductions from the replacement of one million older vehicles. Table 3 shows the impact of replacing one million cars of a given model year with a car built in 2009. Reductions are a percentage of the total loadings of all U.S. gasoline powered cars, light trucks, and motorcycles in the 2005 fleet. As with gasoline consumption, all reductions are less than 1%. In some cases reductions may be greater than 1% when emission control system degradation with age and mileage is factored in.
Table 3. Fleet Tailpipe Emission Reductions
| Replacing 1 million vehicles from….. | Reduces total CO emissions by….. | Reduces total VOC emissions by….. | Reduces total NOx emissions by….. |
|
1980 |
0.1050% |
0.1203% |
0.8004% |
|
1990 |
0.0000% |
0.1088% |
0.3446% |
|
2000 |
0.0000% |
0.0576% |
0.1223% |
Sources: EPA, ORNL, EPRINC Calculations
Carbon dioxide (CO2) emissions will not be appreciably reduced by this program. Vehicle CO2 emissions are directly proportional to the quantity of gasoline consumed. As stated in the previous section, U.S. gasoline consumption will be reduced 0.17% in the most optimistic scenario; therefore vehicle CO2 emissions would see a similarly small decline, 0.035% of all annual U.S. CO2 emissions.
Appendix:
Note on the UNOCAL “Cash for Clunkers” Program
Subsidized jalopy scrapping was successfully implemented in the U.S. in the 1990′s by Unocal and similar programs are in part responsible for the current growth in European auto sales. (Auto sales are growing year-over-year in some European countries as a result of these programs.) The Clean Air Act Amendments of 1990 encouraged the accelerated retirement of old cars as a method for controlling emissions. In 1990 Unocal started the South Coast Auto Recycle Program (SCRAP) which purchased nearly any active vehicle built before 1971 for $700 in cash so that it could be scrapped. Unocal began this project as a means to earn emissions credits for its Los Angeles marine terminal after Federal regulations were put in place requiring companies to reduce pollution at their facilities or acquire credits. Unocal received financial support for the program from both the public and private sector: the South Coast Air Quality Management District, the California Community Foundation, and Ford Automobile Company were among the contributors. Unocal purchased and scrapped 8,350 vehicles (though it had offers for many more) and the EPA called the program “encouraging” and “an example of a well-run program that thoroughly documented emissions reductions.”
It is important to note that Unocal was offered more cars than it wished to purchase. This is due to the fact that Unocal on average paid more for the cars than they were worth. In its assessment of the program, EPA conducted a survey of the Gold Book and found that the majority of domestic, non-sports cars built in 1973 (the last year featured in the Gold Book) had a value below $600, much less than the $700 Unocal offered, and that 1971 models would have been even less valuable. EPA also notes that many owners sold cars to Unocal with a market price well over $700 due to the program’s convenience and a desire to help the environment. Although consumers were given cash for their clunker, as opposed to a credit towards a new car, an EPA survey found that 76% of participants bought a car built in 1975 or later and 12% did not replace their car. 1975 marked the introduction of catalytic converters, meaning the replacement of a car built prior to 1975 with one built afterwards represented a drastic improvement in emissions.


