
Rising fuel prices are a recurring political concern, especially in an election year. Since the start of the Iran War, the average U.S. retail price of regular gasoline has climbed from $2.91 per gallon in February 2026 to $4.06 in August, an increase of almost 40 percent. Prices remain elevated heading into November: AAA reported a national average of $4.17 per gallon on November 2, and this was the first year the national average stayed above $4 through October. National averages, however, hide wide differences between states in both prices and how much people drive.
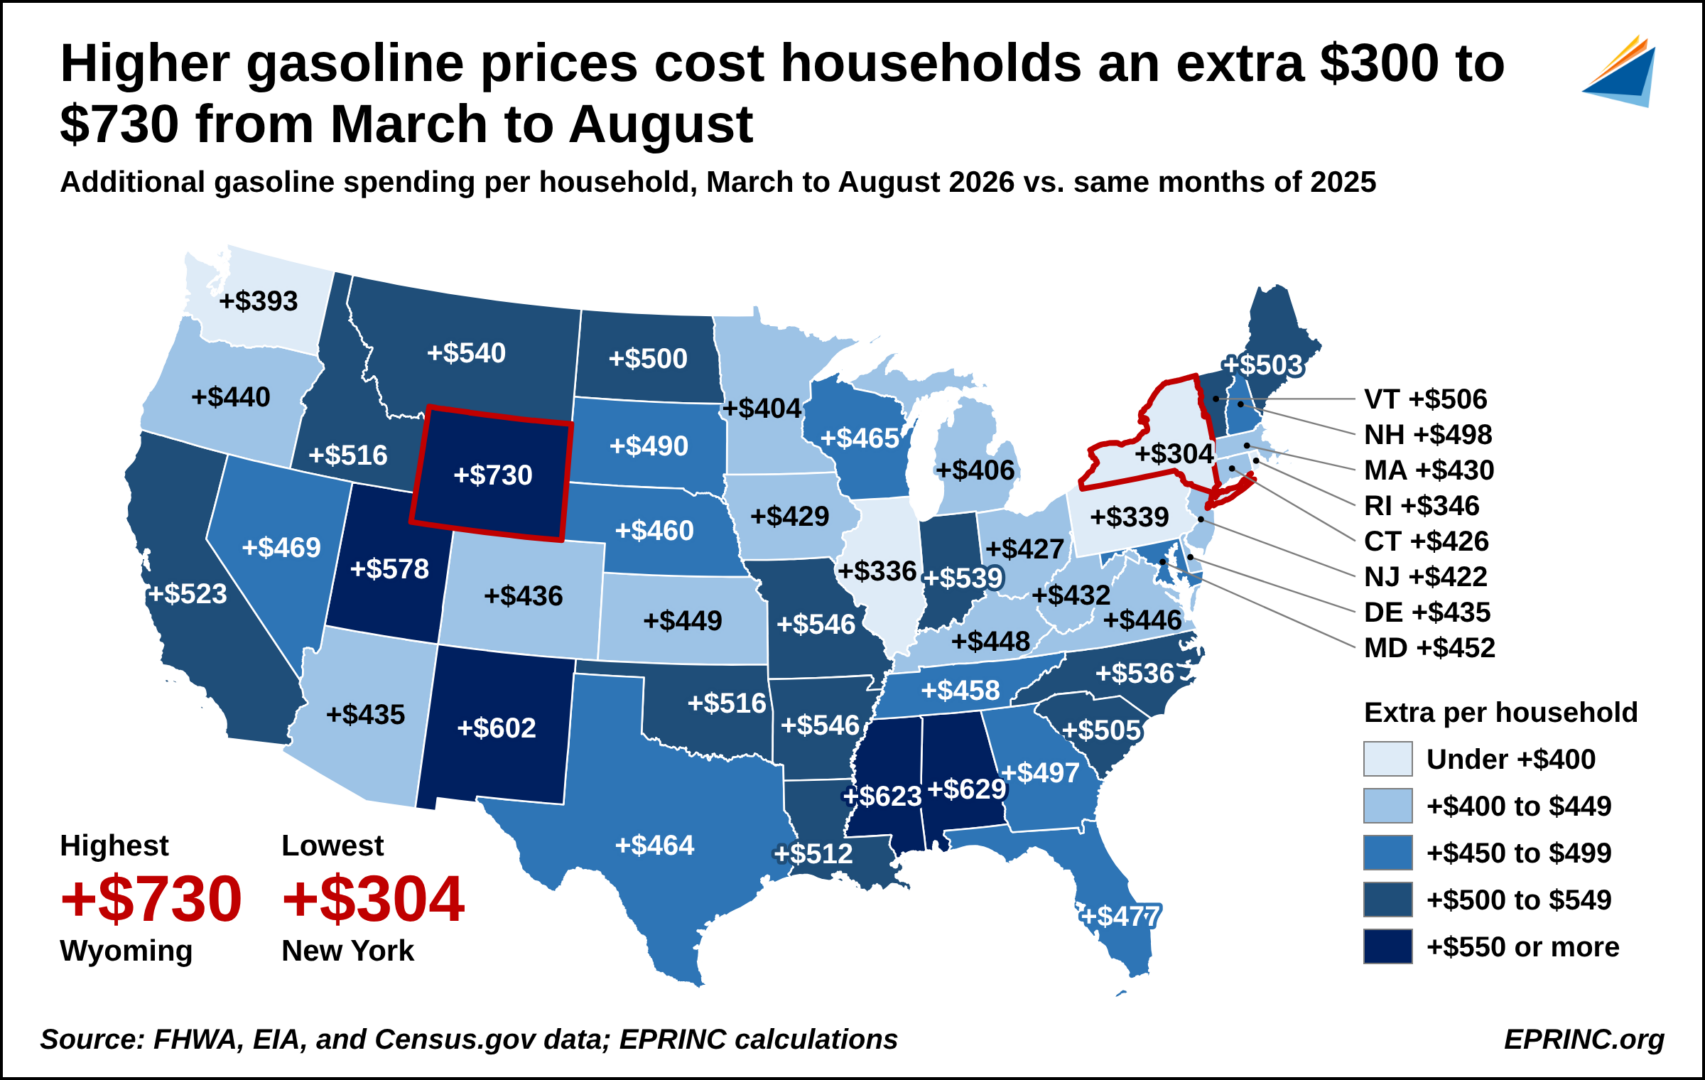
Combining state-level retail prices with state-level driving shows that the burden is unevenly distributed. From March through August, the typical household paid between $304 and $730 more for gasoline than in the same months a year earlier (Figure 1). Wyoming households saw the largest increase at $730, followed by Alabama ($629), Mississippi ($623), and New Mexico ($602). New York households saw the smallest, at $304, with Illinois ($336), Pennsylvania ($339), and Rhode Island ($346) close behind. State averages also reflect how people live: a large share of New York households are in New York City, where many residents drive little or not at all, so the statewide figure understates costs upstate, where they are likely closer to those in rural, high-mileage states like Wyoming.
California and Texas, which rank first and second in total vehicle miles traveled (VMT), fall in between, at $523 and $464 per household. Drivers in the two states have responded differently to higher prices: California’s VMT in August was 4.7% lower than a year earlier, while Texas’s fell only 2.1%.
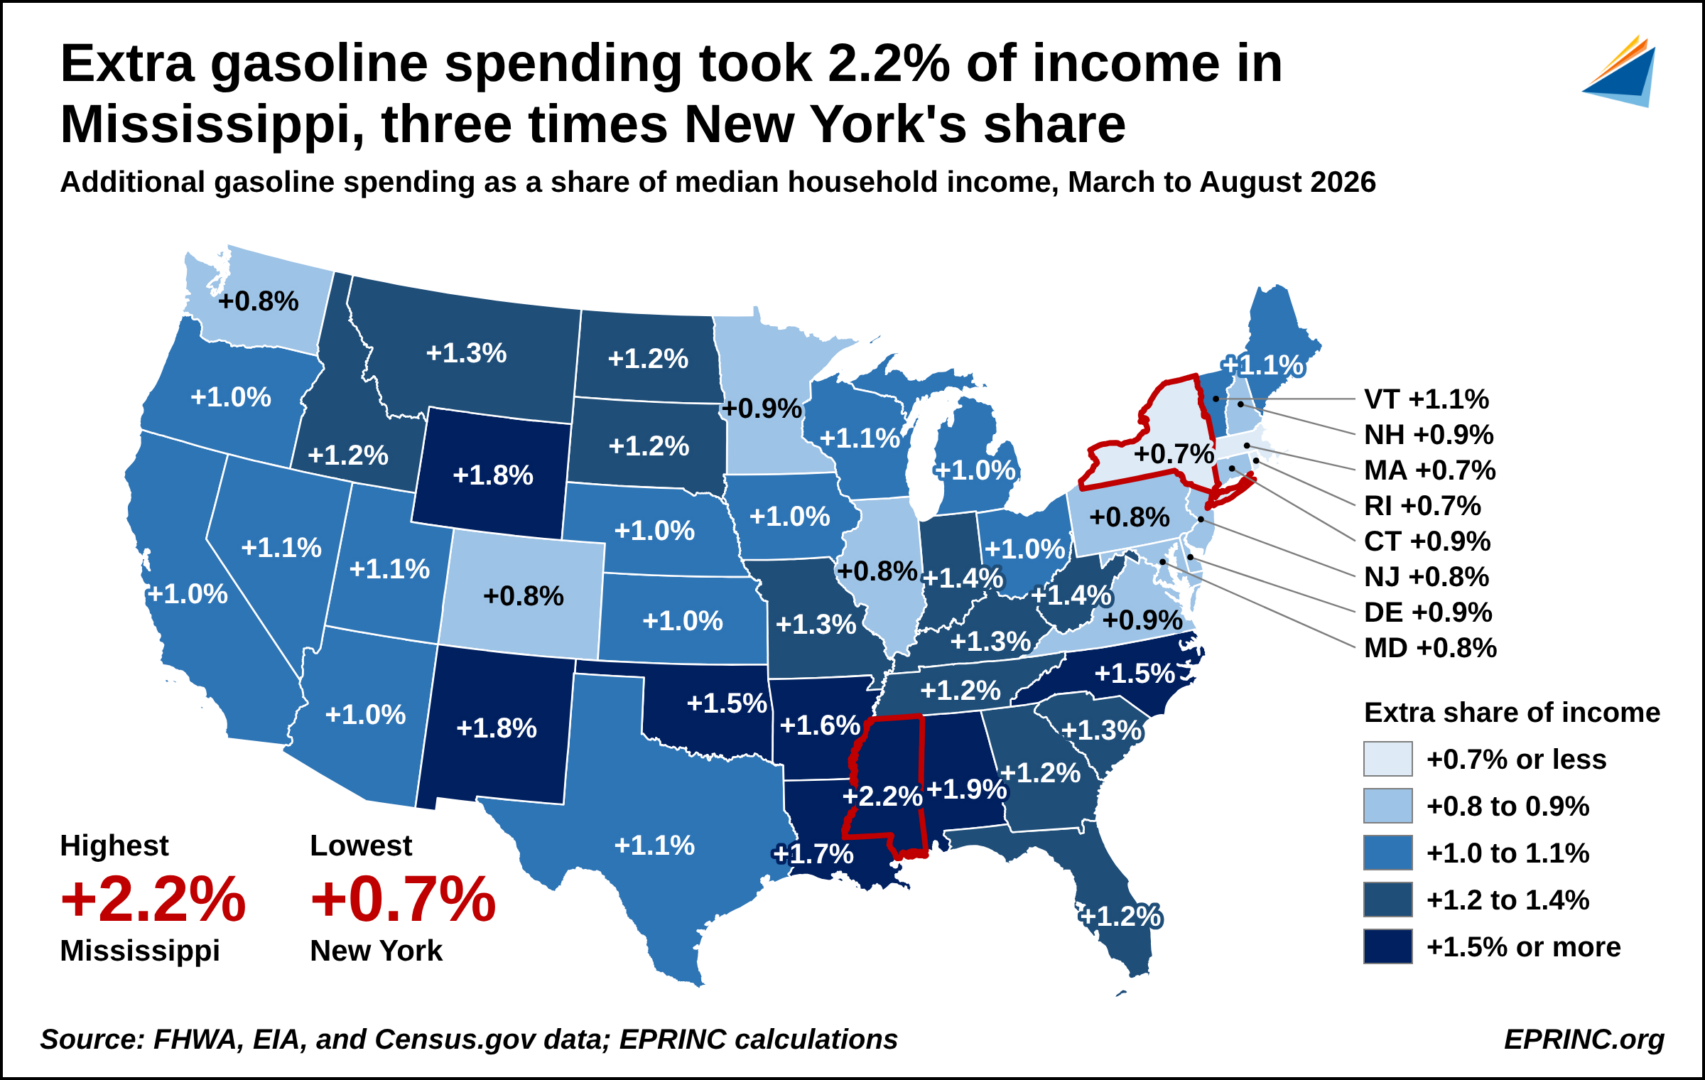
Measured against income, the ranking shifts (Figure 2). In Mississippi, the extra gasoline spending absorbed 2.2% of median household income over the six months, three times New York’s 0.7%. Alabama (1.9%), New Mexico (1.8%), Wyoming (1.8%), and Louisiana (1.7%) follow. Wyoming falls from first to fourth because its incomes are higher. For context, before prices rose, households in the median state spent about 3.8% of income on gasoline.
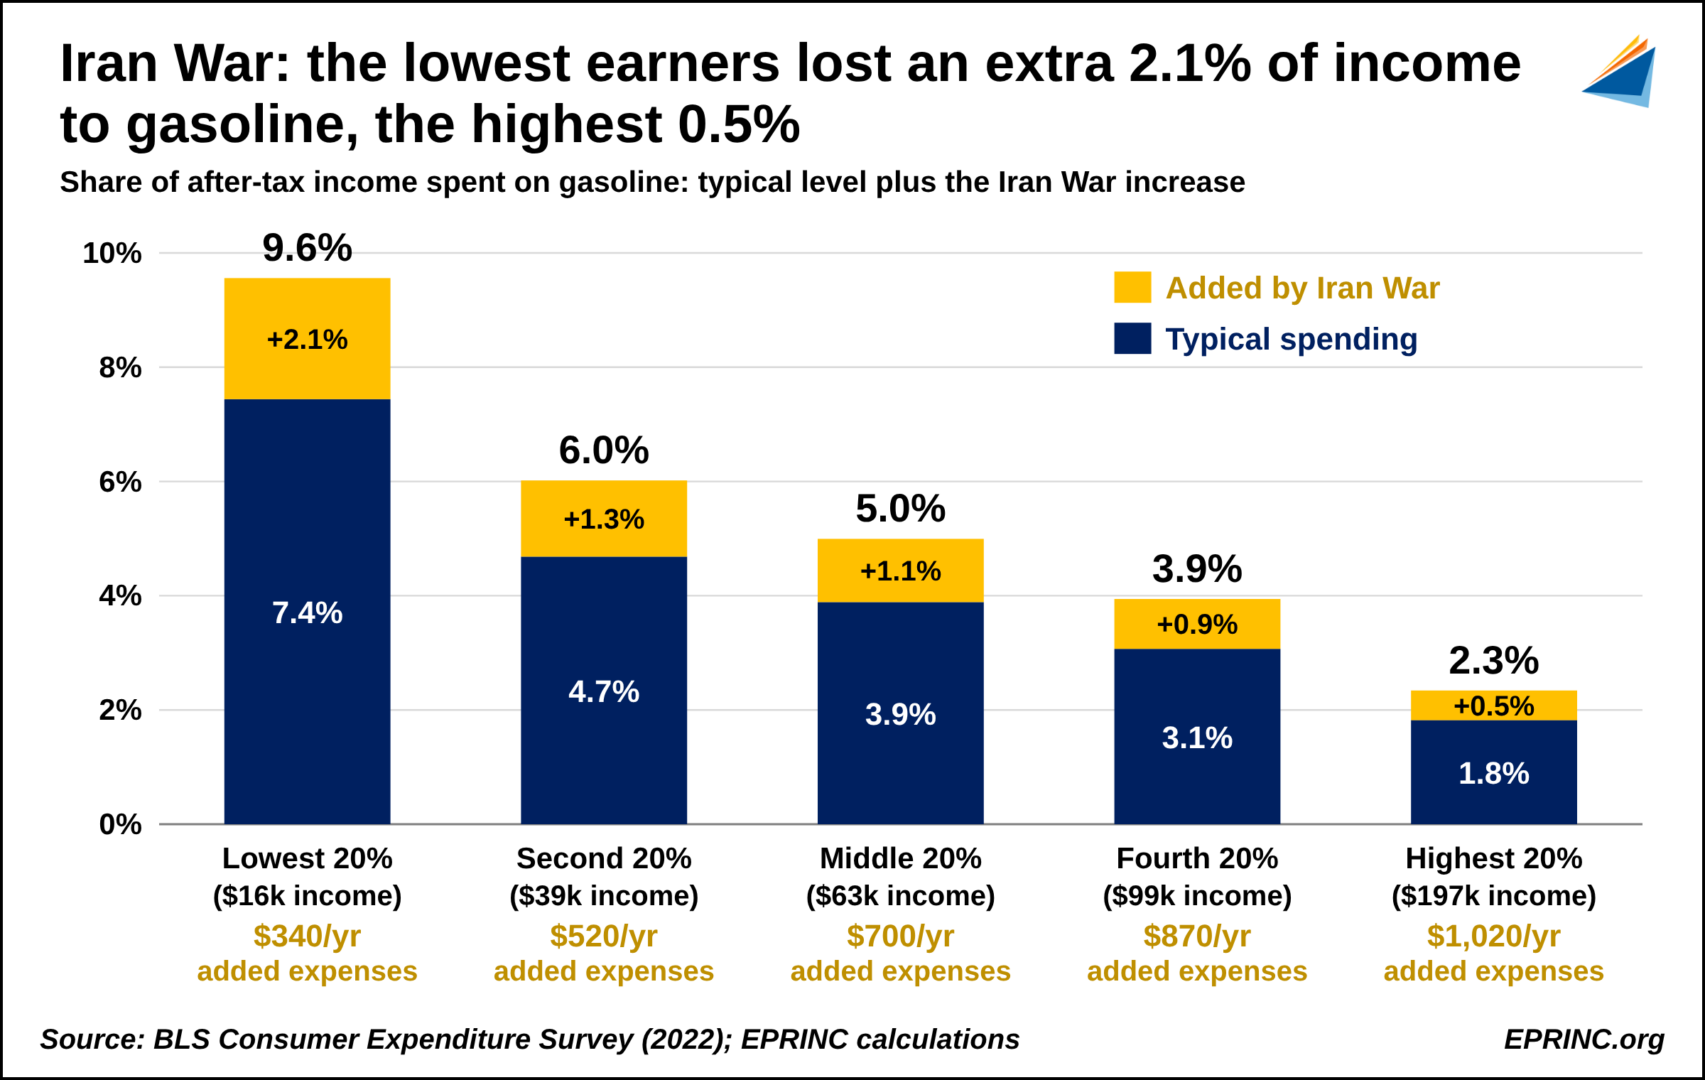
The same pattern holds across income groups nationally (Figure 3). Before the increase, households in the lowest income fifth spent about 7.4% of after-tax income on gasoline; the Iran War price rise added roughly 2.1 percentage points, or about $340 a year. Households in the highest income fifth pay more in dollars, about $1,020 a year, because they drive more, but the increase amounts to only 0.5% of their income. Gasoline price shocks are regressive: they take the largest share of income from the households with the least of it.
Methodology: For each state and month, household gasoline consumption was estimated from 2025 vehicle miles traveled (FHWA), an assumed average fuel economy of 24 miles per gallon, and a 90% household share. That volume was multiplied by the year-on-year change in the state’s average retail price of regular gasoline (EIA), summed over March through August 2026, and divided by the number of households (Census). Figure 2 divides that result by six months of state median household income (Census, 2024 to 2025 average). Figure 3 uses the BLS Consumer Expenditure Survey for 2022, a year with average gasoline prices close to today’s, scaled by the 28.5% rise in household gasoline spending found in the state data; dollar figures in Figure 3 are annual. Alaska, Hawaii, and the District of Columbia are excluded. The analysis ends in August, the most recent month of published state VMT data.
Cite: EPRINC, “U.S. Household Gasoline Costs by State and Income: March to August 2026,” Chart of the Week 2026-38, November 3, 2026.