
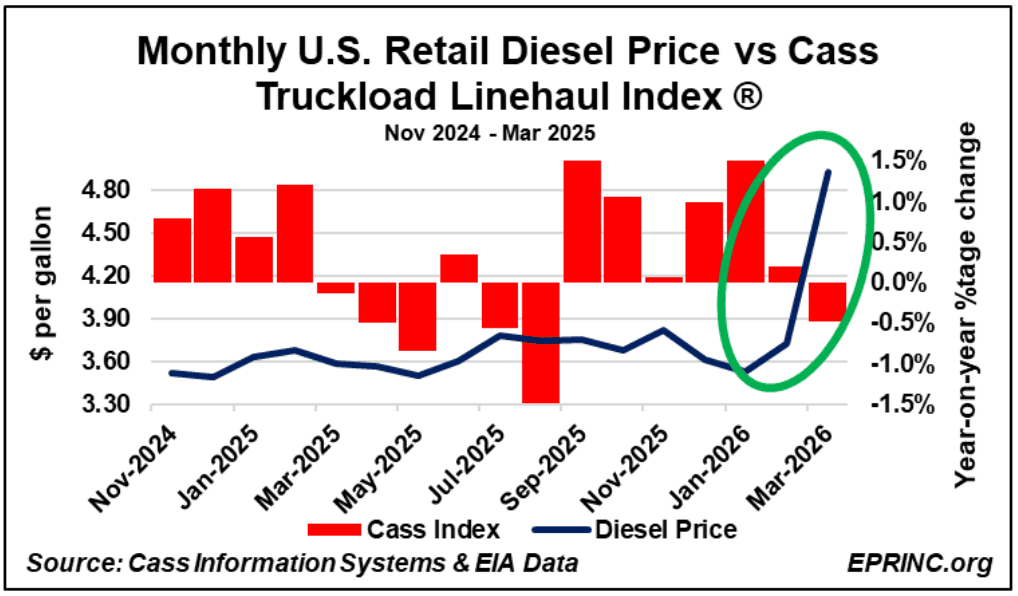
The chart pairs two time-series that together offer a directional read on demand for durable and consumer goods as they move from manufacturer to warehouse and from warehouse to retail. Diesel prices and trucking activity reflect the relative strength or weakness of both wholesale (business-to-business) and retail (consumer) markets, and they can either support or challenge headline economic indicators. The trucking measure draws on the Cass Truckload Linehaul Index®, which isolates per-mile truckload pricing from fuel and accessory costs.
Ahead of President Trump’s January 2025 inauguration, diesel prices were low and trucking activity was rising. Through most of 2025, however, shifting administration tariff policy contributed to economic headwinds, supply-chain recalibrations, and a decline in trucking activity. With diesel prices remaining docile, some rebound in economic activity and trucking took place during the fourth quarter of 2025 and much of the first quarter of 2026.
That recovery reversed with the closure of the Strait of Hormuz. The Israel/U.S.–Iran War that began on February 28, 2026, shut a critical chokepoint for the flow of hydrocarbons, nitrogen-based fertilizer, and helium, threatening shortfalls across Europe, Africa, and Asia. As diesel prices spiked, U.S. trucking activity began to decline on a year-on-year basis.
The United States, given its substantial domestic production, is relatively insulated from these shortfalls. Even so, commodities exposed to global markets and actively traded internationally—fuels among them—remain subject to the price impacts of the Hormuz closure. EPRINC’s consolidated coverage of the crisis is available here.
From the EPRINC Chart of the Week archive.