
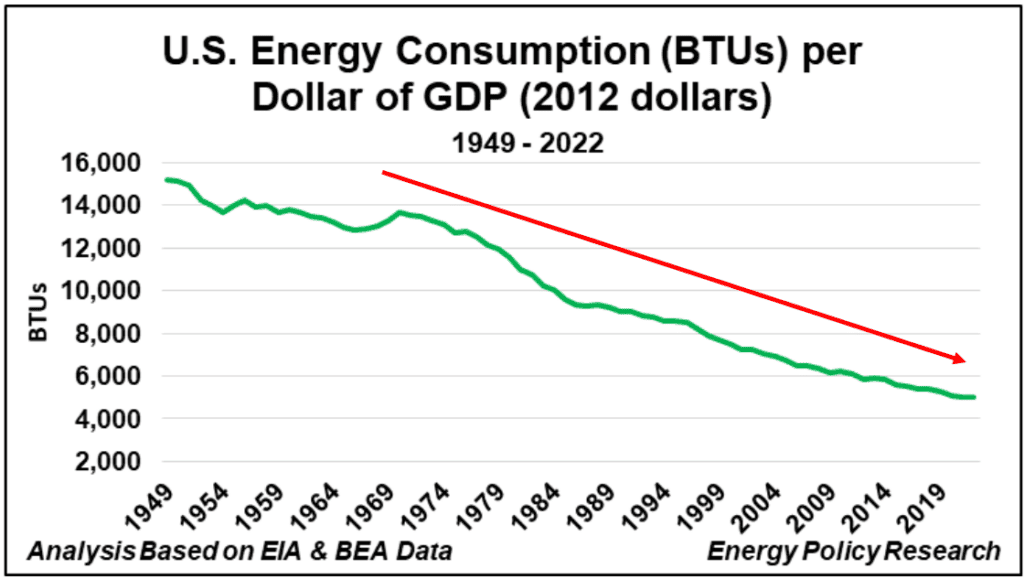
Energy security can be described along three dimensions: availability, affordability, and acceptability. Acceptability, in turn, can be broken down into efficiency and environmental impact. One way to gauge efficiency is to divide total energy consumed by total inflation-adjusted GDP, yielding a measure of how much economic output the economy generates per unit of energy.
This chart draws on annual primary energy consumption data compiled by the U.S. Energy Information Administration (EIA) and the chained 2012-dollar GDP time series compiled by the U.S. Bureau of Economic Analysis (BEA). Over the period from 1949 to 2022, U.S. energy efficiency improved at an annualized rate of 1.5%, while inflation-adjusted GDP rose 3.1% per year.
The pattern indicates that the U.S. economy has grown substantially faster than its energy consumption, using energy more productively over time even as output expanded. This long-run gain in efficiency is one component of the broader assessment of U.S. energy security.

From the EPRINC Chart of the Week archive.