
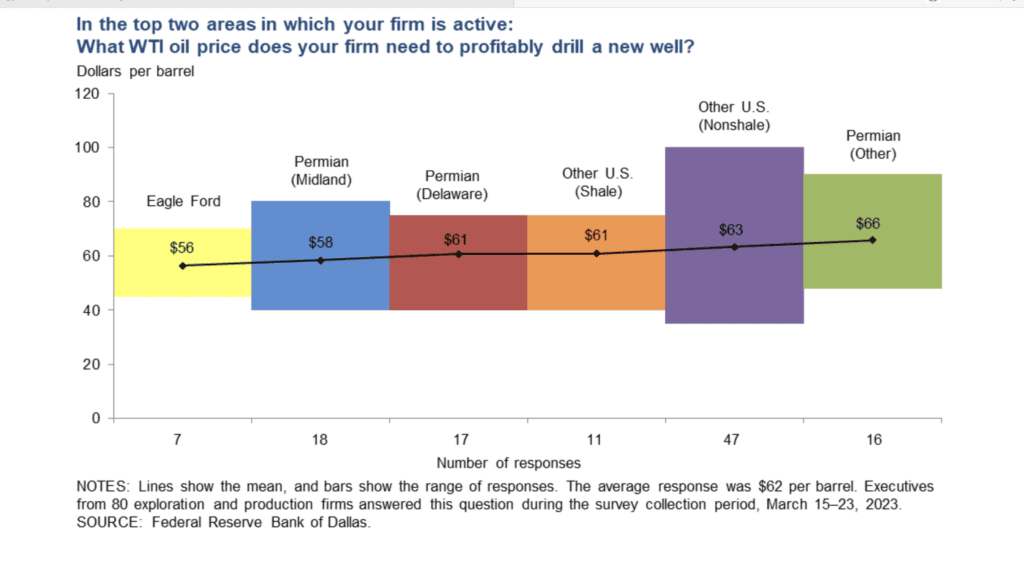
Each quarter the Dallas Federal Reserve Bank surveys U.S. crude oil and natural gas producers to gauge metrics material to a key sector of its district, including production growth, employment, capital expenditures, and producers’ views on operating costs and profitability. This chart tracks the WTI (West Texas Intermediate) benchmark prices producers report as necessary to sustain operations and to remain profitable.
When the COVID pandemic set in during the first quarter of 2020, a sharp negative demand shock followed. With interest rates at zero and labor plentiful, production costs troughed. In that quarter, respondents reported an average required WTI price of $29/bbl to maintain U.S. operations and an average of $49/bbl to be profitable. WTI averaged $40/bbl during 2020, then rose through 2021 as the economy recovered, peaking above $120/bbl in early 2022.
The first quarter 2023 survey produced significantly higher figures, reflecting recent inflationary trends. Though results vary by producing region, the average reported breakeven WTI price was $35/bbl and the average price required for profitability was $61/bbl. After declining from their early 2022 peaks, WTI prices have been range-bound since November 2022, fluctuating between the upper $60s and the low $80s.
In the aggregate, the surveys imply an annualized producer inflation rate for U.S. oil and gas production of 5.8% for operating costs and 7.3% for required profitability. Over the same period, the U.S. Bureau of Labor Statistics Total Mining Industry Producer Price Index showed an annualized increase of 15.9%.

From the EPRINC Chart of the Week archive.