
Beginning in the mid-2000s, U.S. natural gas production began to increase from averaging 55 billion cubic feet per day (BCF/d) in 2008 to over 100 BCF/d in the current period. This is thanks to the combination of hydrofracturing and horizontal drilling, key technological developments that allow the extraction of both crude oil and natural gas from shale rock formations.
By 2012, plans and capital were put in place to begin constructing LNG (liquefied natural gas) facilities along the U.S. Gulf coast in order to export the surplus of increasing volumes.
First cargos were shipped in 2016, and total volume has risen to 13 BCF/d in 2022.
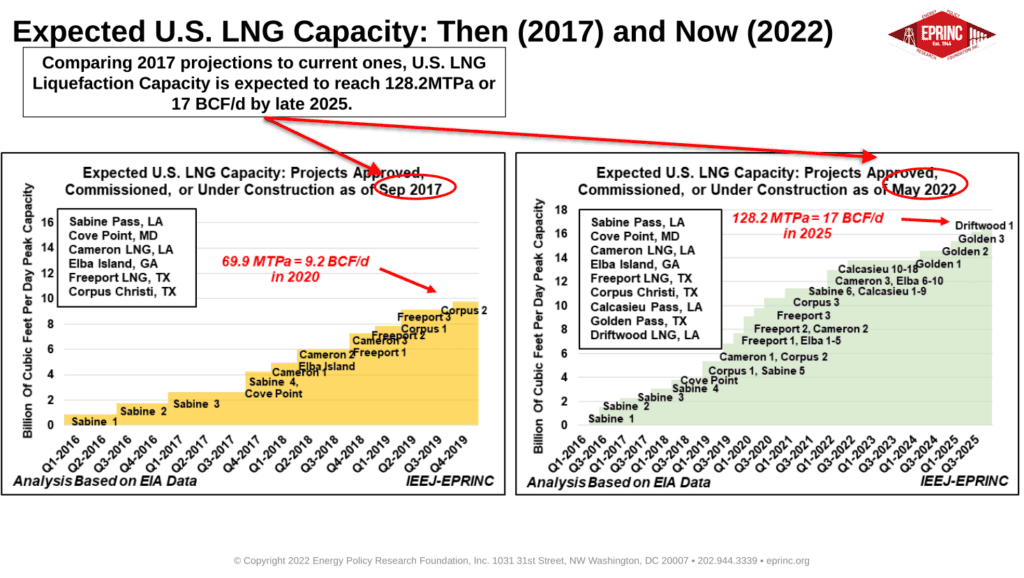
In 2017, U.S. liquefaction capacity was expected to reach 9.2 BCF/d (70 million metric tons per year) based on projects that had made final investment decisions (FID).
Despite some abandonment of initial plans, LNG producers have increased their commitments either to expansions of current facilities or more new projects. As of May 2022, U.S. liquefaction capacity is now expected to reach 17 BCF/d, or 128.2 million tons per year (MTP/a), by the end of 2025.
Although not all US LNG will be exported to Europe, the total potential volume of US LNG exports in 2025 under ideal circumstances would be substantial, and would represent over 40% of European import requirements.
From the EPRINC Chart of the Week archive.