
About EPRINC
The Energy Policy Research Foundation, Inc. (EPRINC) was founded in 1944 and is a not-for-profit, non-partisan organization that studies energy economics and government policy initiatives with special emphasis on oil, natural gas, and petroleum product markets. EPRINC is routinely called upon to testify before Congress as well to provide briefings for government officials and legislators. Its research and presentations are circulated widely without charge through posts on its website. EPRINC’s popular Embassy Series convenes periodic meetings and discussions with the Washington diplomatic community, industry experts, and policy makers on topical issues in energy policy.
EPRINC has been a source of expertise for numerous government studies, and both its chairman and president have participated in major assessments undertaken by the National Petroleum Council. In recent years, EPRINC has undertaken long-term assessments of the economic and strategic implications of the North American petroleum renaissance, reviews of the role of renewable fuels in the transportation sector, and evaluations of the economic contribution of petroleum infrastructure to the national economy. Most recently, EPRINC has been engaged on an assessment of the future of U.S. LNG exports to Asia and the growing importance of Mexico in sustaining the productivity and growth of the North American petroleum production platform.
EPRINC receives undirected research support from the private sector and foundations, and it has undertaken directed research from the U.S. government from both the U.S. Department of Energy and the U.S. Department of Defense. EPRINC publications can be found on its website: www.eprinc.org.
About the Author
Rafael Sandrea is President of IPC Petroleum Consultants, Inc., a Tulsa-based international petroleum consulting firm which specializes in oil and gas reserves appraisals and risk analysis for international upstream petroleum investments. He is a very active host of webinars and masterclasses online, and speaks regularly on the themes of reserves, IOR/EOR, shale oil and gas assessment, and global oil & gas supply around the world. He is also a Distinguished Fellow at EPRINC.
Dr. Sandrea is a life-member of the SPE, and member of the UN Ad Hoc Group of Experts on Fossil Resources – Geneva. He has published over 40 technical papers covering areas such as risk analysis for international upstream petroleum investments; appraisal of global oil and gas reserves — conventional and unconventional; development of algorithms for estimating the production capacity of new oil and gas fields, for estimating the reserves of mature oil & gas fields; global offshore oil reserves potential; assessment of global oil and gas resources, and their potential for enhanced oil recovery — EOR. Together with Dr. Ralph Nielsen, he has published the book: “Dynamics of Petroleum Reservoirs under Gas Injection,” Gulf Publishing, which has been used in petroleum engineering schools worldwide. He recently co-authored the book: “Mexico-History of Oil Exploration,” PennWellBooks.com, Sept. 2018. He is a member of the Penn Energy Research Emissary expert marketplace program: info@emissary.io.
Dr. Sandrea holds a PhD in petroleum engineering from Penn State University.
Global oil (liquids) demand essentially crashed to 92.2 mb/d (million barrels per day) in 2020, an 8 percent drop from the previous year, upended by the devastating COVID-19 pandemic. Before this, demand was clipping along at a historical growth rate of 1.16 mb/d per year since the 1990s (Fig. 1), reaching an all-time high of 100.2 mb/d in 2019 with expectations to continue to grow to 110.3 mb/d by 2035.
As a consequence of the pandemic, global supply is now expected to reach 100 mb/d at the end of 2021. Likewise, crude oil supply, which had dipped to a low of 72.3 mb/d in 2020 from a previous high of 82.3 mb/d in 2019, has also recovered a bit and is now on its path towards 77 mb/d in 2021. As a whole, there are strong signs that we are getting out of the woods.
Figure 1: Global Petroleum Liquids Demand and Crude Oil Supply (million b/d)
Source: EIA, BP Statistical Review, Energy Aspects 2021
Note: Petroleum liquids supply includes crude oil as well as other liquids such as ethane, propane, butane, isobutane, pentane, etc., which are produced along with natural gas when crude oil is produced. There are many uses for these liquids across all sectors of the economy, and their use has increased in recent years resulting in incentivized drilling in liquids-rich resources.
Demand
Oil demand in high-consuming countries like China and India is already back to pre-pandemic levels. U.S. demand had bottomed out to 18.6 mb/d in 2020 from a previous all-time high of 21 mb/d in 2019, and then an additional drop occurred due to the Texas Freeze in February of 2021. The EIA now expects consumption to increase to 19.5 mb/d at the end of 2021 and to 20.5 mb/d in 2022.
Figure 2 provides a visual breakdown of the robust oil demand by region before 2020. All seven regions show continuous growth over the last 25 years. Asia-Pacific, the world’s largest regional oil consumer accounting for 36%, is also the fastest-growing region, and it too is now on a strong recovery path. There is no reason to believe that a booming global demand could abruptly be close to peaking after a one-year COVID-19 crisis.
Figure 2: World Oil Production (LHS) and Consumption by Region before 2020 (million b/d). Source: BP Statistical Review 2019.
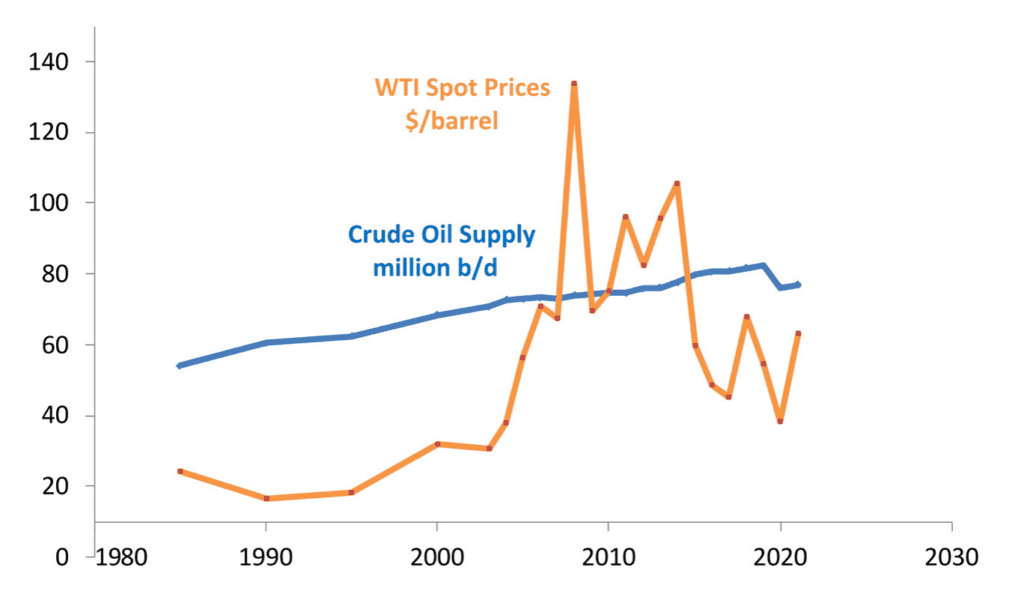
KAPSARC (Jan. 2021) predicts global oil demand to increase by 4.2 mb/d in 2021 and to further grow by 3.5 mb/d in 2022, returning to 2019 levels by Q3 of 2022. The International Monetary Fund (IMF) predicts global economic growth of around 5.4% in 2021. WTI oil prices have been rallying from a low of $18 in April 2020 and are now (Feb. 25) at $63, $3 above prices last seen in January 2020 (Fig. 3).
For sure, all of these predictions assume that growth will not be affected by any new waves of the virus. It is our responsibility to keep this recovery going.
Oil and natural gas are the most popular fuel sources of world energy consumption, together accounting for more than half (57%) of the energy mix, and will remain so for the foreseeable future. Percentages for oil and gas together historically changed barely 4 points over 50 years.
In the context of consumption, the term oil generally refers to petroleum liquids, which are made up of four components: crude oil (80%), NGLs (12%), refining gains (2%), and biofuels. Crude oil, including condensates, is the ingredient which is produced at the well head and is the only component that grows or declines in relationship with the volume of reserves.
As can be seen in Fig. 1, crude oil has had a diminishing role in the total supply mix over the past three decades. In 1985 it accounted for 91%, compared with 80% today. NGLs is a strong component of today’s supply mix, with a current contribution of 12 mb/d, up from 8 mb/d in 2010 — a growth rate of 440,000 b/d per year. Sixty-four percent of the increase of NGLs comes from the U.S. tight oil revolution.
Renewable energy (solar, wind, and others) is the newcomer to the global energy mix and has soared from ‘insignificant’ two decades ago to 11.2 mb/d of equivalent oil in 2018, and has been growing at a robust rate of 850,000 b/d per year over the last decade. It is the world’s fastest growing energy source, with huge sums of money flowing into it — $282 billion in 2019, led by China (29%), U.S. (19.5%), and Europe (19%). In response to a persistent increasing pre-COVID-19 global energy demand, NGLs and renewables have been taking up the slack in the global crude oil supply.
As shown in Fig. 3, two decades ago global crude oil output was on a steady growth path of 0.95 mb/d per year, which began to weaken after 2005, dropping considerably to a low of 0.32 mb/d per year through 2010. Output was 73 mb/d in 2005 and had barely increased to 74.6 mb/d by
Figure 3: Global Crude Oil Supply and WTI Spot Prices. Source: EIA
Supply
Just before 2010, with crude oil output at a flat 75 mb/d, we struck gold — U.S. tight oil production kicked in, thanks to new drilling and completion technologies. Global crude oil production capacity regained growth and by 2018 had reached near 82 mb/d.
These booming tight oil plays have turned the U.S. into a net oil exporter for the first time in 75 years. U.S. crude oil production rose from a low of 5 mb/d in 2008 to 12 mb/d in 2019, a colossal rise. U.S. crude output fell 10% (1.1 mb/d) to 9.7 mb/d during the Texas big freeze of February 2021. However, as of February 24, World Oil News asserts that Permian Basin output had already been restored 80%. According to the EIA, this unexpected U.S. production plunge would affect overall output for the 2021 year by 200,000 to 500,000 b/d; the spread is due to undetermined (this early) operational aspects among a mix of several thousand mature and tight oil fields that were shut-in.
Returning to the plateauing effect of global crude oil production sans tight oil displayed in Fig. 3, it is a predictable consequence of reserves depletion. Global oil and gas discoveries have been on a constant shrinking trend prior to and over the last decade, Fig. 4, with oil discoveries reaching a low of 3.8 Bbo (billion barrels of oil) in 2016; in 2020 it was 4.3 Bbo. During the same period, 89 Bbo of oil were discovered while 289 Bbo of reserves were produced, a ratio of over 3 to 1, which is unsustainable.
Fig. 4 also shows that exploration spending has dropped from a high of $95 billion in 2014 to $40 billion in 2019, just about 7.3% of global E&P capex. According to Rystad Energy, global E&P capex reached a historical high of $880 billion in 2014 and is expected to hit around $311 billion in 2021, only a little higher than the $243 billion for Renewables.
F&D costs for DW projects like Guyana run about $13 per barrel, with hurdle rates of 18%. Comparable costs for renewables are $42/barrel with hurdle rates around 10-11%. Renewables, in terms of equivalent oil, have been growing at about 6.7 Bboe per year.
Offshore has emerged as the preferred province for exploration, accounting for three-quarters of all oil and gas discoveries. Offshore typically holds larger reservoirs with high well-productivities in the range of 10,000 b/d (barrels per day) to 30,000+ b/d, both important factors for making potential discoveries lucrative.
Figure 4: Global Oil and Gas Discoveries, Exploration Spend. Source: Rystad Energy, Wood Mackenzie.
Closing Thoughts
The COVID-19 pandemic of 2020 has been very devastating in many ways. The hope is that we are in the period of its recovery stage. Oil and natural gas are the most popular fuel sources of world energy consumption, together accounting for more than half (57%) of the energy mix and will remain so for the foreseeable future.
Oil accounts for one third (34%) of the mix and urgently requires large and prompt investments to placate an ongoing decline which would certainly push prices up; just a couple months ago $70 oil seemed optimistic. These investments must be prompt because discoveries take 5-10 years to reach the start-up production point, and large because just replacing the reserves we are now producing, circa 30 Bbo per year, is a huge challenge. After all, we are barely discovering 4 Bbo each year at this time.
Exploration spend in the good years usually soared as high as 20% of total E&P capital expenditures, but recently this percentage has dropped to single digits. Regarding the climate crisis and cutting greenhouse emissions from oil and gas operations, Shell’s CEO said it best: “nobody in his right mind denies that this is an issue that needs to be tackled urgently.”
Ultimately, as critical as investments are, success in exploration is highly dependent on the deductive reasoning prowess that distinguishes the explorationist. Exploration is a unique science.
- BP Statistical Review of World Energy 2019.
- Energy Aspects Fundamentals, February 24, 2021.
- KAPSARC, Oil Market Outlook, Q1 2021.
- IFP Energies Nouvelles (IFPEN), Economic Outlook New Oil & Gas Discoveries 2018, July 30, 2019.
- Rafael Sandrea, Global Oil Supply Growth at a Crossroads, Exploration Needs a Robust Resurgence, ipc66.com, Feb., 2020.
- Oil and Gas Trends 2018-2019, strategyand.pwc.com.
- Mark P. Mills, Testimony Before U.S. Senate Committee on Energy and Natural Resources on Establishing a Baseline of Global Climate Facts: Understanding the Scale and Source of Contributions, February 3, 2021.
- Leigh R. Goehring and Adam A. Rozencwajg, Ignoring Energy Transition Realities, Q4 2020. Report: Natural Resource Market Commentary by Goehring & Rozencwajg Associates, February 2021.
- A Tale of Shrinking Reserves and Rising Profits, Goldman Sachs 18th Edition Annual Review Top Assets in Global Oil and Gas, March 24, 2021.
From the EPRINC Chart of the Week archive.