
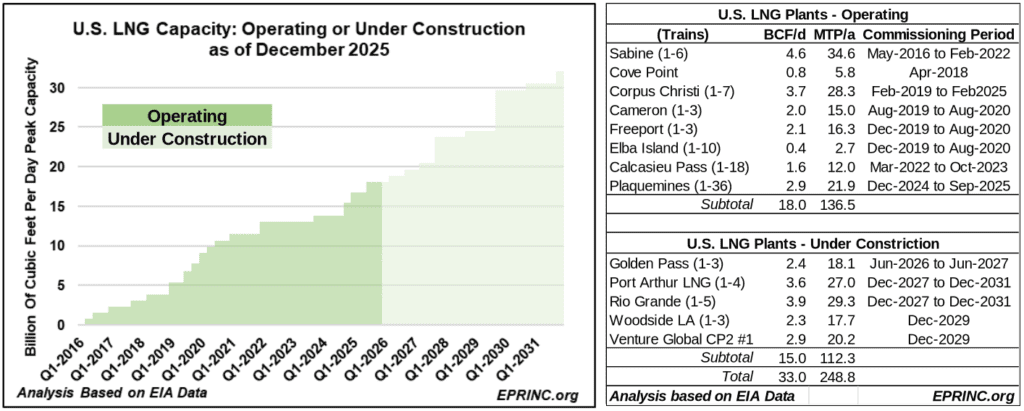
The chart tracks U.S. LNG export capacity by facility, distinguishing volumes currently in operation from those under construction and scheduled for commissioning.
In the mid-2000s, U.S. natural gas production began to increase from an average of 58 billion cubic feet per day (BCF/d) in 2008 to over 120 BCF/d in November 2025. This is thanks to the combination of hydrofracturing and horizontal drilling, key technological developments that allow the extraction of both crude oil and natural gas from shale rock formations.
By 2012, plans and capital were put in place to begin constructing LNG (liquefied natural gas) facilities along the U.S. Gulf Coast in order to export the surplus of increasing volumes.
First cargos were shipped in 2016. Most recently, EIA reported that total volume reached 17.5 BCF/d in November 2025.
As of December 2025, total operating U.S. LNG export capacity stood at 18 BCF/d, or 136.5 million metric tons per annum (MTP/a). Currently, there is another 15 BCF/d (112.3 MTP/a) that is under construction scheduled to be commissioned between June 2026 and December 2031.
Despite some abandonment of initial plans, LNG producers have increased their commitments either to expansions of current facilities or more new projects. Currently, there is an additional 13.3 BCF/d (101.3 MTP/a) of capacity that has received permitting but has not yet commenced construction.
For more information on this chart, please contact Max Pyziur (maxp@eprinc.org).
From the EPRINC Chart of the Week archive.