
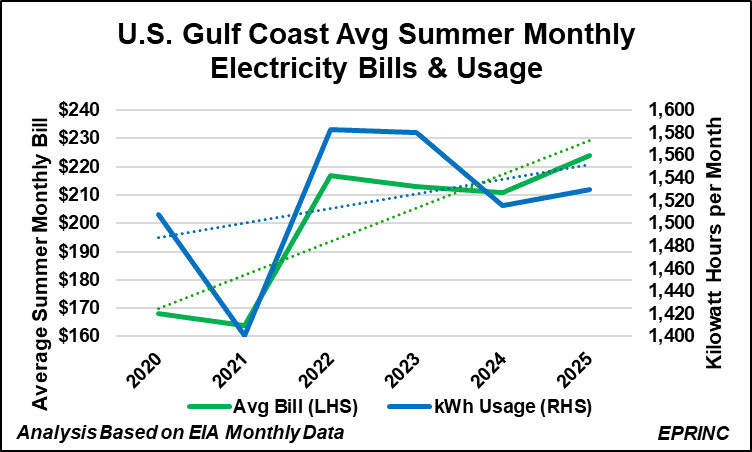
This Chart of the Week examines U.S. summer (June, July, August) residential electricity trends at both the national level and across two contrasting regions, drawing on the U.S. Energy Information Administration’s (EIA) Summer Fuels data referenced in its May 2025 Short-Term Energy Outlook (see p.3); the underlying data is available here.
Nationally, average summer residential bills are trending upward, rising from $148 in 2020 to an expected $186 in 2025, an annualized rate of 4.7%. Over the same period, average monthly usage declined modestly at an annual rate of 0.5%, from 1,116 kWh in 2020 to an expected 1,086 kWh in 2025. This decline reflects cooling demand, efficiency gains, and demographic shifts.
Regional patterns vary considerably:
- Gulf Coast (Texas dominant): Average summer monthly consumption rose slightly, from 1,508 kWh to 1,530 kWh (0.3% annualized), while monthly bills rose at a faster 5.9% annual rate, from $168 to $224.
- Pacific Coast (primarily California): With the lowest historical regional usage, consumption fell from 730 kWh in 2020 to 657 kWh in 2025 (a 2.1% annualized decrease), yet bills saw the highest percentage rise of any region, climbing 6.9% annually from $168 to $224.
Beyond operational and demographic factors, policies such as renewable portfolio standards, production and investment tax credits, and the composition of generating assets (dispatchable versus intermittent) all bear on what consumers ultimately pay.

From the EPRINC Chart of the Week archive.